In today’s dynamic and distributed hybrid IT environments, maintaining a clear view of system performance and health is essential for delivering digital services. As businesses increasingly rely on a mix of on-premises, cloud, and containerized infrastructure, the complexity of managing and optimizing these environments grows. This is where Observability comes in—it empowers IT operations with actionable insights, enabling proactive monitoring, performance optimization, and rapid resolution of incidents and problems.
In this article, we will define Observability and explain its core aspects – known as Metrics, Events, Logs, and Traces (MELT) – and why each of these is critical to building a comprehensive view of your hybrid environments.
We will also explore various types of IT monitoring, including Application, Network, Cloud, and Server monitoring, and how they contribute valuable data to enhance Observability in hybrid environments.
What is Observability?
Observability is the ability to understand the internal state of a system by analyzing its external outputs, such as logs, metrics, and traces. It enables IT teams to diagnose system behavior in real-time, identify performance issues, detect anomalies, and predict potential problems, offering a broader and deeper view than traditional monitoring approaches alone.
For IT and IT operations leaders, as well as anyone responsible for delivering digital services, Observability is key to reducing downtime, improving operational efficiency, and ensuring service reliability—all of which contribute directly to achieving business goals.
MELT: The Core of Observability
At the heart of Observability lies the MELT framework, consisting of Metrics, Events, Logs, and Traces. Each of these components plays a critical role in providing the visibility and context IT operations need to ensure system reliability, performance, and scalability across diverse infrastructures, particularly in hybrid IT environments.
Metrics
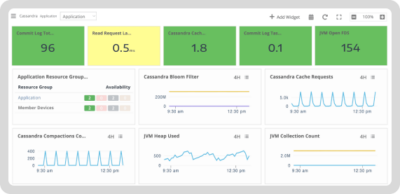
Metrics represent numerical data points collected over time, providing insight into resource utilization, performance trends, and system health. Common metrics include CPU usage, memory consumption, disk I/O, and network throughput. Metrics help IT and IT operations teams establish performance baselines and track deviations from normal behavior, allowing for early detection of potential issues before they affect users. These are essential for capacity planning, trend analysis, and setting performance thresholds that trigger alerts. Tools like HPE OpsRamp aggregate metrics across hybrid environments, enabling a unified view of both cloud and on-prem resources.
Metrics represent numerical data points collected over time, providing insight into resource utilization, performance trends, and system health. Common metrics include CPU usage, memory consumption, disk I/O, and network throughput. Metrics help IT and IT operations teams establish performance baselines and track deviations from normal behavior, allowing for early detection of potential issues before they affect users. These are essential for capacity planning, trend analysis, and setting performance thresholds that trigger alerts. Tools like HPE OpsRamp aggregate metrics across hybrid environments, enabling a unified view of both cloud and on-prem resources.
Events
Events capture significant occurrences within the system, such as the failure–or other important state changes–of an IT resource.Eventscontainvaluable context and metadata, and can help correlate changes in the performance of an IT resource to specific actions or triggers associated with other IT resources. Events are critical in root cause analysis, as they often provide a direct link between a change and its subsequent impact on the system. By monitoring events, and correlating multiple events together, IT teams can quickly identify and address performance or health issues before they escalate into major incidents or outages.
Events capture significant occurrences within the system, such as the failure–or other important state changes–of an IT resource.Eventscontainvaluable context and metadata, and can help correlate changes in the performance of an IT resource to specific actions or triggers associated with other IT resources. Events are critical in root cause analysis, as they often provide a direct link between a change and its subsequent impact on the system. By monitoring events, and correlating multiple events together, IT teams can quickly identify and address performance or health issues before they escalate into major incidents or outages.
Logs
Logs are detailed records of events or transactions within the system. They provide granular data that can be used to troubleshoot specific problems, offering deep visibility into the activities occurring within the system. Logs contain timestamps, error codes, transaction details, and process statuses, making them invaluable for deep-dive forensics, post-incident analysis and real-time troubleshooting. With an effective log management system, teams can track and filter relevant log entries to quickly pinpoint the root cause of an issue.
Logs are detailed records of events or transactions within the system. They provide granular data that can be used to troubleshoot specific problems, offering deep visibility into the activities occurring within the system. Logs contain timestamps, error codes, transaction details, and process statuses, making them invaluable for deep-dive forensics, post-incident analysis and real-time troubleshooting. With an effective log management system, teams can track and filter relevant log entries to quickly pinpoint the root cause of an issue.
Traces follow the journey of a request as it travels through various services and components within a distributed system. In modern microservices architectures, a single request might touch multiple services, databases, and APIs. Tracing enables teams to visualize the flow of these requests and identify bottlenecks, latencies, or failures at specific points in the journey. By following traces, IT teams can optimize the performance of individual services and ensure that systems work cohesively, making tracing an essential tool for performance tuning in complex, distributed environments such as microservices-based applications.
Traces follow the journey of a request as it travels through various services and components within a distributed system. In modern microservices architectures, a single request might touch multiple services, databases, and APIs. Tracing enables teams to visualize the flow of these requests and identify bottlenecks, latencies, or failures at specific points in the journey. By following traces, IT teams can optimize the performance of individual services and ensure that systems work cohesively, making tracing an essential tool for performance tuning in complex, distributed environments such as microservices-based applications.
The MELT framework provides a holistic view of system behavior, allowing IT teams to monitor and correlate data from different sources. Metrics give you the “what,” events and logs explain the “why,” and traces show “where” the issue occurred. Together, they allow teams to proactively address problems, reduce downtime, and ensure better user experience. Observability tools like OpsRamp integrate these elements into a single platform, offering unified observability, and enabling organizations to easily and efficiently manage the complexity of hybrid IT environments.
By fully leveraging MELT, IT teams can ensure optimal system performance, proactively address issues, and provide reliable digital services to their customers.
Observability and Different Types of Monitoring
Observability is achieved by integrating various types of monitoring tools and capabilities, each of which provides unique insights into different aspects of the IT infrastructure.
Application Performance Monitoring (APM)
APM tracks the performance of applications, focusing on response times, transaction throughput, and error rates. Tools like OpsRamp’s APM offer proactive detection of performance bottlenecks and dependencies between applications and infrastructure. By reducing latency and improving throughput, APM ensures smooth application performance and an enhanced user experience.
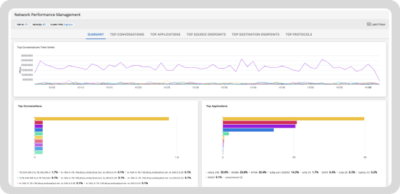
NPM helps improve the health of network infrastructure by tracking metrics like packet loss, latency, and bandwidth usage. With real-time network discovery and alerting, NPM helps prevent performance bottlenecks and provides root cause analysis when connectivity issues crop up. For IT teams, NPM is essential for maintaining the smooth operation of network traffic, whether on-premises or across cloud environments.
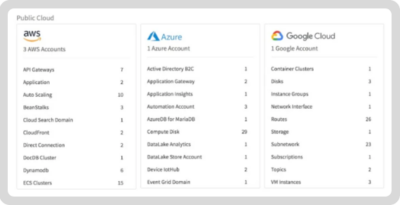
As more businesses migrate to the cloud, monitoring cloud resources is critical. Cloud monitoring tools track resource utilization, performance, and availability across hybrid and multi-cloud environments. This enables IT teams to optimize cloud spend, scale infrastructure effectively, and maintain service-level agreements (SLAs).
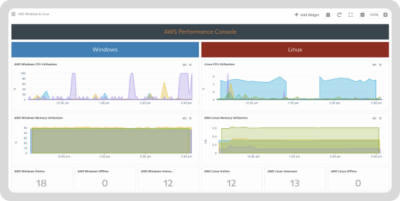
Server monitoring tools provide visibility into the health and performance of physical and virtual servers. By tracking CPU, memory, disk utilization, and other server resources that impact the health and performance of a server, server monitoring ensures optimal performance and minimizes downtime due to hardware or resource issues.
Storage monitoring ensures that storage systems, whether SAN, NAS, or cloud-based, are functioning efficiently. Monitoring disk I/O performance, capacity, and latency ensures that critical applications can access data quickly without bottlenecks.
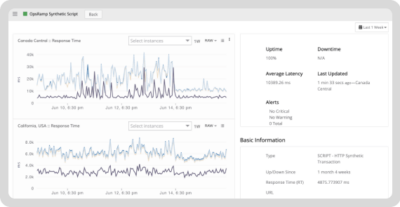
Synthetic monitoring involves simulating user interactions with applications to detect issues before they impact real users. This proactive approach helps organizations maintainoptimal service levels by identifying potential bottlenecks or failures before they affect end-users.
Container and virtualization monitoring focus on the performance of containerized applications (like Docker) and virtual machines (VMs). These tools help track resource consumption and the performance of container orchestration systems like Kubernetes, ensuring that dynamic environments run efficiently.
Why Observability is Essential for Hybrid IT Environments
For businesses running hybrid IT environments, which span on-premises infrastructure, public and private clouds, observability is indispensable. It provides a unified, real-time view of all systems and services, enabling IT and IT operations teams to ensure that their infrastructure remains reliable, scalable, and efficient across multiple environments. Observability helps teams proactively detect and resolve issues, ensuring optimal performance and high availability for digital services, whether hosted in the cloud or on-prem.
In hybrid environments, the complexity of managing diverse infrastructure makes real-time insights critical. By correlating data from various monitoring types—like application, network, cloud, and server monitoring—teams can quickly identify performance bottlenecks and take corrective action before disruptions occur. This proactive approach reduces downtime, optimizes resource usage, and lowers operational expenses.
OpsRamp, with its unified observability capability, is specifically designed to manage the complexity of hybrid IT environments. By providing a consolidated view of the health and performance of both on-premises and cloud-based resources, OpsRamp empowers IT teams to maintain peak performance and ensure that digital services are consistently reliable and responsive as businesses scale.