AWS recently introduced its hosted Prometheus offering, which greatly eases the process of metric aggregation across applications and infrastructure running both inside and out of AWS.
Prometheus is the most versatile monitoring tool and one of the first open-source Cloud Native Computing Foundation (CNCF) projects. It integrates well with many applications and cloud service providers. Prometheus is a very sophisticated tool with its own time series database (TSDB) that stores metrics information for your applications and infrastructure. Unlike various popular monitoring tools, Prometheus works on a metric pull mechanism: It is not dependent on any agent pushing data to the Prometheus server because the server scrapes metrics off different targets.
Prometheus helps agile development teams gain insights into their applications and infrastructure. The metrics provided by Prometheus help them develop faster, ship more quickly, and find bugs and anomalies earlier in the development cycle. Prometheus can be a self-managed service where teams provision and maintain their own instances, and it can also be used as a hosted cloud offering.
In the following sections, we will learn about Prometheus’s main features at a high level and deep dive into some essential Prometheus-related concepts.
Bird’s Eye View
Before we dig into the various features of AWS Prometheus, let’s look at some advantages of a hosted Prometheus offering.
| High Availability | Prometheus is a critical application and requires high availability (HA). In the case of a hosted offering, the cloud provider ensures high availability of Prometheus. |
| Cost-Effectiveness | Self-managed Prometheus can become expensive quickly due to growing cloud costs and administrative overhead. A hosted offering is more cost-effective. |
| User Management | Prometheus does not offer any native user management, but in the case of a hosted Prometheus offering, access to Prometheus can be controlled using the provider’s user management system. AWS Prometheus integrates directly with the Identity and Access Management (IAM) service, ensuring secure access. |
| Easy Scaling | The AWS managed service provisions and scales the application according to your growing needs, removing responsibility for it from your operations teams. |
The following table should help you understand various Prometheus features that are typical of both hosted and self-managed setups.
| Multidimensional Data Model | Prometheus offers a multidimensional data model with time series data identified by key-value pairs. |
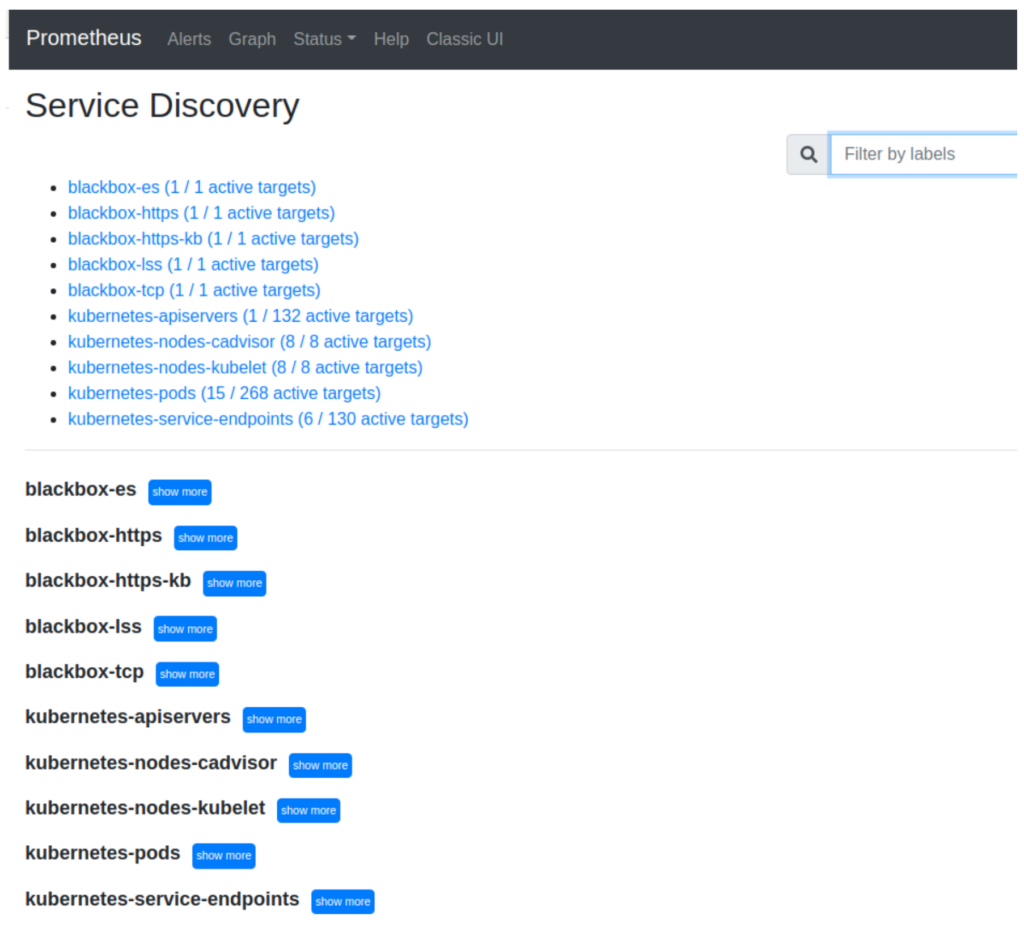
| Dynamic Target Discovery | Prometheus targets can be statically defined, but most production environments leverage Prometheus’s dynamic service discovery capabilities. This helps operators avoid configuration changes while being able to add, remove, or scrape targets dynamically. |
| Pull-Based Metric Collection | Time-series metric collection happens over HTTP using a pull-based mechanism. As a result, Prometheus targets are only responsible for exposing metrics in a specific format on an HTTP endpoint, and Prometheus can automatically scrape them. An intermediary push gateway is available for short-lived metric sources in some scenarios. |
| Independent Single Server Mode | Prometheus does not rely on distributed storage, so single server nodes are entirely autonomous. While this is a helpful feature in non-production scenarios, in the case of a production environment, some enhancements are required to ensure that the system is highly available |
AWS Prometheus Deep Dive
It is extremely easy to get started with AWS Managed Prometheus. Essentially, you need to configure your local Prometheus instance’s remote write endpoint to write metrics to the Amazon Managed Prometheus (AMP) instance. The following diagram explains it visually.
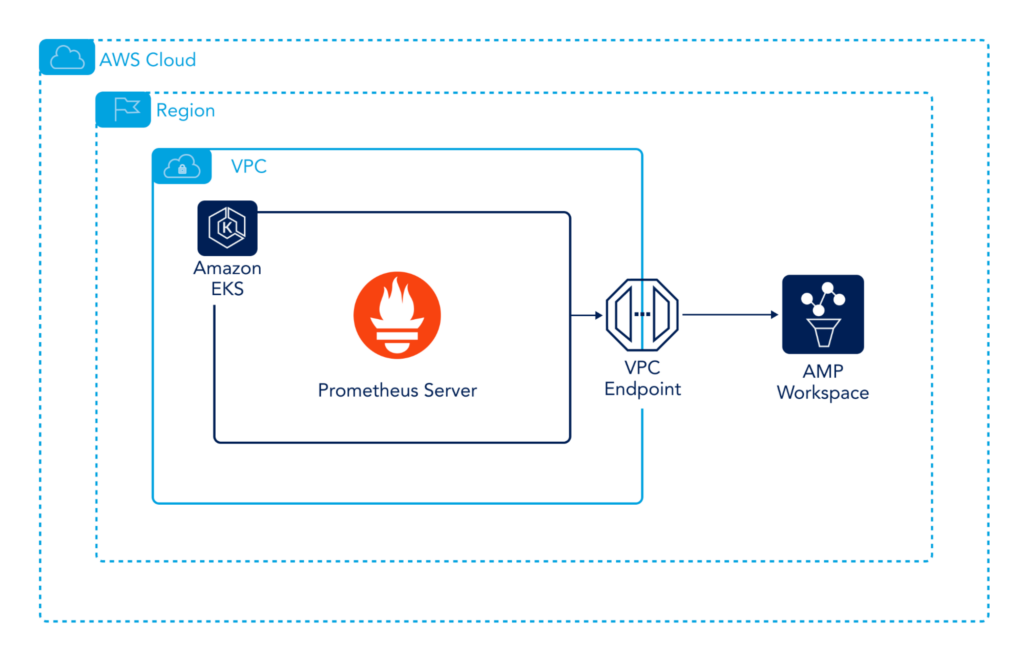
As you can see in the figure above, we have a Prometheus server deployed inside an EKS cluster, which is configured to remote-write to the AMP Workspace. The VPC endpoint is optional, and you can directly write to the AMP Workspace, depending upon your setup.
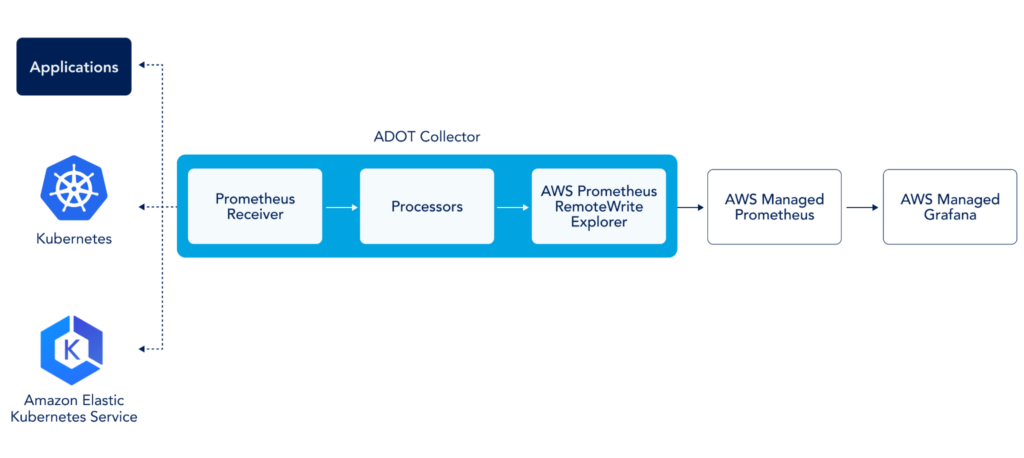
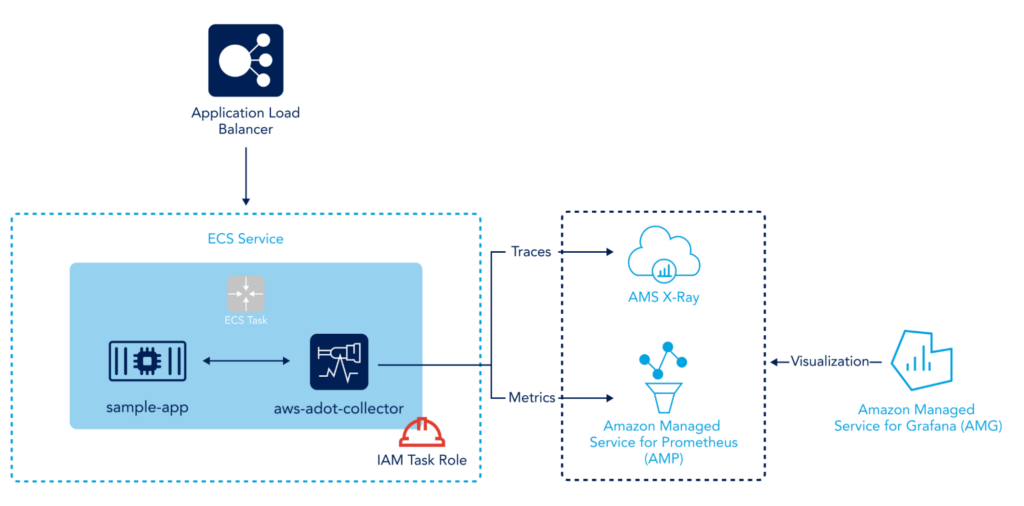
Another approach to sending metrics to an AMP workspace is by using AWS Distro for Open Telemetry Collector (ADOT). In this case, we would deploy the ADOT collector, which has a Prometheus receiver, metrics processor, and remote write exporter running to ship your metrics to the AMP Workspace. The following diagram explains how this works.
The integration is designed to let you keep using your current Prometheus server while offloading all the heavy lifting to the AMP Workspace. However, it offers much more than that. Let’s take a look at some of its prominent features.
Scaling
AWS Prometheus alleviates a major scaling pain point for operations teams. Prometheus does not have any out-of-the-box scaling support, and teams usually cluster it with Thanos or Cortex to achieve scaling targets. Both of these options are configuration-intensive, requiring considerable maintenance over time. In the case of a hosted service such as AWS Prometheus, all the scaling tasks can be offloaded to the service provider, and teams can focus on monitoring endpoints.
Fine-Grained Access Management
Another missing piece in Prometheus is access control. Prometheus does not have any built-in constructs for users and groups. However, with Amazon’s hosted Prometheus service, we can leverage AWS IAM to provide fine-grained access to the Prometheus instance. It’s typically required to have access controls in place for compliance purposes and to ensure that security best practices are followed.
Unified Container Monitoring
AWS Prometheus seamlessly integrates with Amazon’s Elastic Kubernetes Service (EKS) and Elastic Container Service (ECS). Furthermore, it includes APIs so that teams can securely ingest, query, and alert on metrics from self-managed Kubernetes clusters hosted on AWS or on premises (in a data center). It provides a centralized view for all the metrics for all containerized workloads. Coupled with IAM access control, you can allow teams to view and analyze metrics relevant to their use cases without irrelevant metrics overwhelming their dashboards.

Low Operational Cost
Using a hosted Prometheus service might initially sound costly. However, once you factor in all the engineering labor costs involved in deploying, administering, and scaling the self-managed instances and add in the infrastructure expenses, it proves to be more efficient than running self-managed Prometheus servers.
Integration with AWS Observability Services
AWS Prometheus has native integration with other observability services, such as AWS Distro for OpenTelemetry, as a collection agent for Prometheus metrics using AWS Grafana for visualization. Grafana is a tool that can help you analyze Prometheus metrics and create insightful dashboards based on them. This article provides more insight into the AWS’s Hosted Grafana offering.
The integration with AWS Grafana is advantageous for developing a single-pane-of-glass view of all metrics from Prometheus. Grafana also allows querying for metrics, so teams never really need to access Prometheus directly. Grafana can also consume metrics from other sources, such as Cloudwatch, enabling a combined view of your other AWS services.
Alternative to AWS Prometheus for High Availability
High availability is critical for running any service in a production environment. Unfortunately, Prometheus does not support HA and horizontal scaling out of the box. To achieve this level of scalability and resilience, operators must integrate with Thanos or Cortex. Thanos is a highly available and scalable Prometheus setup. It has various components that run independently, but it interacts with Prometheus by running a containerized sidecar.
On the other hand, Cortex is a scalable Prometheus storage service that leverages Prometheus’s remote write capabilities to achieve production-level scaling and high availability.
There is no doubt that Thanos and Cortex help with Prometheus Scaling, high availability, and long-term metric retention, but these services are difficult to configure and manage. For smaller operations teams, they could be a time sink. The ability to offload high availability and scalability is a distinct advantage of a hosted Prometheus offering.
Beyond AWS Prometheus
AWS Prometheus is a reliable service, and it integrates with many other AWS services to provide a combined view of your AWS metrics. However, a monitoring system is more than just centralized metric aggregation for a single cloud provider. Modern applications and infrastructure require systems that can provide teams with actionable insights and sometimes go the extra mile to apply those recommendations.
OpsRamp is based on Prometheus Cortex, delivering Prometheus HA, horizontal scaling, and native support for PromQL. The OpsRamp Platform includes advanced event correlation algorithms that analyze the pattern of alerts and automatically perform corrective actions. It also integrates with all public cloud providers and technologies hosted in a data center, providing a single pane of glass for all your monitoring needs.
OpsRamp provides a holistic solution backed by machine learning algorithms and workflow automation to satisfy all of your hybrid cloud monitoring requirements. It also takes care of high availability and scaling needs for a production-level monitoring system. You can learn more about its Prometheus-related functionality here.
Summary
Prometheus is a critical part of any monitoring toolchain, and managing Prometheus in a production environment is undoubtedly a huge undertaking. A hosted Prometheus offering can be very beneficial for small, agile software development teams. AWS Prometheus eases the provisioning and management of Prometheus and lets you concentrate on making the most of ingested metrics. Solutions like OpsRamp take this further by integrating data from a hybrid cloud environment, leveraging efficient ML algorithms to provide actionable insights based on your metrics, and automating the remediation workflow.
You like our article?
Follow our monthly hybrid cloud digest on LinkedIn to receive more free educational content like this.