Modern applications consist of containers, serverless functions, microservices, and more. While we can monitor the performance of each part individually, monitoring the end-user experience of applications is most valuable.
Synthetic monitoring solves that general problem by using synthetic traffic to simulate visitors’ requests to test user-facing endpoints. You can even proactively detect issues in private test environments before end users notice them with synthetic monitoring. AWS CloudWatch Synthetics is a popular synthetic monitoring solution on the AWS platform.
Specifically, AWS CloudWatch Synthetics enables monitoring of:
- REST APIs
- URLs,
- Website content
- Unauthorized changes from phishing, code injection, and cross-site scripting
Here, to help you hit the ground running with CloudWatch Synthetics, we’ll review its architecture and its primary construct – canaries. Then, we’ll also explore methods to create Canaries, CloudWatch Synthetics parameters (metrics, alarms, data storage, and retention), and provide a practical example to help you get hands-on with CloudWatch Synthetics.
Understanding Canaries
Before jumping directly to the general architecture of CloudWatch Synthetics, it’s helpful to understand what canaries are and how they work.
What are Canaries?
Canaries are configurable AWS CloudWatch Synthetics scripts used to monitor web applications.
Node.js and Python are two popular scripting languages for writing canary scripts. Canaries generate Lambda functions in an AWS region that can use either of those frameworks.
Canaries support HTTP(S) and monitor endpoints and APIs by checking the latency and availability. Since canary code and results carry sensitive information, you must take precautions when working with canaries. For more on securing canaries, please review security considerations from the AWS docs.
Canaries follow the same actions as a customer, enabling continuous verification of customer experience, even if you do not have any real traffic on your applications yet.
You can run a canary once or on a regular schedule. In addition to checking endpoint availability and latency, canaries can monitor website content, page load times, and store Graphical User Interface (GUI) screenshots. All the data is logged in AWS CloudWatch.
You can also set alarms for immediate notification if your services experience any issues. This proactive alerting can help you quickly fix problems and improve overall customer satisfaction.
Canaries Programmatic Access
In addition to Python and Node.js, Canaries offer programmatic access to a Google Chrome Browser via Puppeteer or Selenium Webdriver. Here is a breakdown of the common methods for programmatic access to Canaries.
| Tools/ Scripting Languages | Definition |
|---|---|
| Selenium | An open-source collection of APIs used for testing web applications. |
| Puppeteer | A Node.js library that provides an automated testing environment, allowing you to run your tests directly in the Chrome browser. |
| Python and Node.js | Two scripting languages you can use to write canaries. |
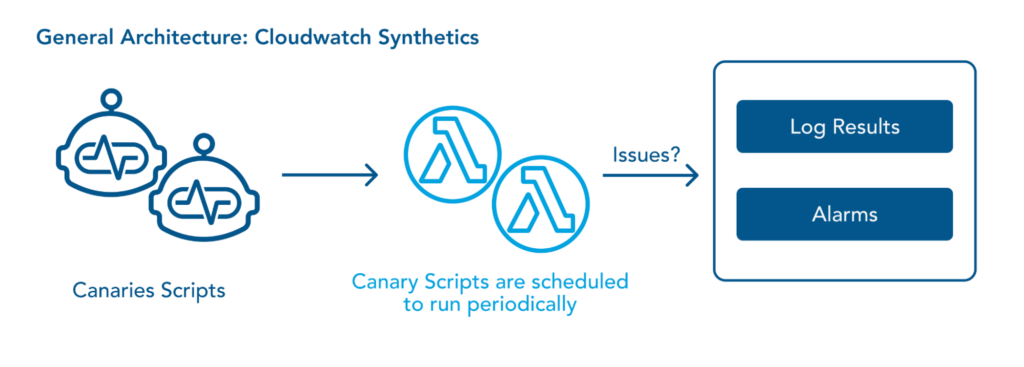
CloudWatch Synthetics: Architecture
CloudWatch Synthetics is an orchestration service, which offers synthetic monitoring to continuously verify customer-facing performance.
The Lambda function created by canaries exposes an interface through which you inject some Node.Js code. This code performs endpoint configuration, authentication, and validation of responses. You can also store responses to an S3 bucket and generate alarms for any value that falls beyond the pre-configured thresholds.
Here is a reference diagram for the general architecture of CloudWatch Synthetics.
Working with Canaries
Now that we understand the fundamentals of CloudWatch Synthetics let’s jump into working with canaries.
Keep in mind that the following AWS implicit resources are created when you create a canary:
- An IAM role with the name CloudWatchSyntheticsRole-canary-name-uuid
- An IAM policy with the name CloudWatchSyntheticsPolicy-canary-name-uuid.
- An S3 bucket with the name cw-syn-results-accountID-region
- Alarms with the name Synthetics-Alarm-MyCanaryName
- Lambda functions and Layers with prefix cwsyn-MyCanaryName.
- CloudWatch Logs log groups with the name : /aws/lambda/cwsyn-MyCanaryName
Creating Canaries
You can create canaries using prebuilt blueprints or by creating custom canaries with CloudFormation templates. Below, we’ll review both methods.
Blueprints
You can create canaries by using ready-made code snippets using the blueprint option from the AWS management console. There are six types of blueprints available, and you can choose one among them according to your use case.
- Heartbeat Monitoring
Heartbeat Monitoring loads the specified URL and stores the page’s screenshot and the HTTP archive file to monitor the URL’s status, duration, and failure reason. You can also use a Heartbeat Monitoring blueprint to monitor multiple URLs if you use syn-nodejs-puppeteer-3.1 or a later runtime version.
- API Canary
Monitoring your APIs will help you maintain your application’s SLA compliance. With the API Canary, you can monitor read and write methods such as GET, POST, PUT, PATCH, and DELETE of representational state transfer or REST API. The API Canary blueprint also supports multi-step canaries, which monitor your APIs as HTTP steps. You can read about the entire solution on setting up API Canary blueprint using HTTP steps here.
- Broken Link Checker
To address the problem of broken links on the websites, you can use a broken link checker canary blueprint. You can enter the starting point (URL) and the number of links to be checked. With this blueprint you can check for these errors:
- 404 Page Not Found
- Bad URL
- Invalid Host Name
- Invalid HTTP response code
- The host server returns empty responses.
- The HTTP requests time out during the canary’s run.
- The host consistently drops connections.
- Visual Monitoring
To monitor visual defects in your web application, you can use the Visual Monitoring blueprint. This blueprint compares screenshots taken during a canary run with screenshots from a baseline run.
You can read more on visual monitoring in the AWS docs.
- Canary Recorder
The Canary Recorder blueprint enables the use of the CloudWatch Synthetics Recorder. The Synthetics Recorder is a Google Chrome Extension to help you create canaries faster and easier. It automatically generates a Node.js script by recording your actions on your app or website.
- GUI Workflow
GUI Workflow Builder Canary blueprint allows you to define test steps on your web applications. Below are the actions that you need to specify before using this blueprint:
- Click— Selects the specified element and simulates a user clicking
- Verify selector— Verifies that the element that you have specified exists on the webpage.
To verify in a Node.js script, you can specify element using format – [id=] or a[class=].
To verify in a Python script, you can specify element using format – xpath //*[@id=] or //*[class=].
- Verify text— Verifies that the mentioned string is contained within the target element.
- Input text— Writes the text that you have specified in the target element.
- Click with navigation— Waits for the whole page to load after selecting the specified element.
Custom Canaries using CloudFormation To create canaries using CloudFormation templates, you must have the necessary IAM policy. You can either create a new IAM policy with iam:CreateRole, iam:CreatePolicy, and iam:AttachRolePolicy permissions, or you can use CloudWatchSyntheticsFullAccess policy. For the JSON entry, this syntax is used:
{
  "Type" : "AWS::Synthetics::Canary",
  "Properties" : {
      "ArtifactConfig" : ArtifactConfig,
      "ArtifactS3Location" : String,
      "Code" : Code,
      "ExecutionRoleArn" : String,
      "FailureRetentionPeriod" : Integer,
      "Name" : String,
      "RunConfig" : RunConfig,
      "RuntimeVersion" : String,
      "Schedule" : Schedule,
      "StartCanaryAfterCreation" : Boolean,
      "SuccessRetentionPeriod" : Integer,
      "Tags" : [ Tag, ... ],
      "VisualReference" : VisualReference,
      "VPCConfig" : VPCConfig
    }
}
For more information regarding the properties of canary artifacts and sample JSON and YAML structure, see AWS Synthetics Canary.
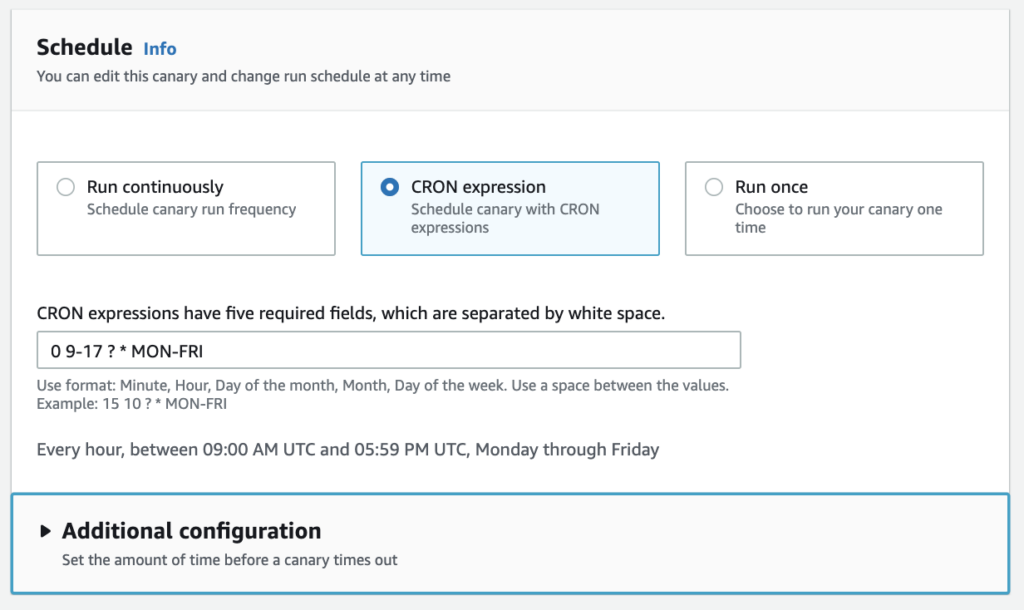
Scheduling Canaries
You can schedule canaries to run at a specific time using built-in cron expression scheduling in Amazon CloudWatch Synthetics. Using built-in cron scheduling, you can monitor your application only at a particular time of the day. For instance, the cron expression “0 9-17 ? * MON-FRI” will schedule a canary that runs:
- On the hour
- Hourly, between 9:00 AM and 5:59 PM UTC(Coordinated Universal Time).
- every month of the year
- Monday through Friday only
The below screenshot shows that schedule in the AWS Management Console:
You can also schedule canaries by using AWS CLI. The CLI command requires an asterisk (*) at the end, which denotes the year :
aws synthetics update-canary --name mycanary --schedule Expression="cron(0 9-17 ? * MON-FRI *)"Data Retention and Data Storage
To retain the data from canary runs, you can use the data retention feature of AWS CloudWatch Synthetics. The data retention period ranges from one day to 455 days. Additionally, you can specify an S3 bucket for storing canary data artifacts.
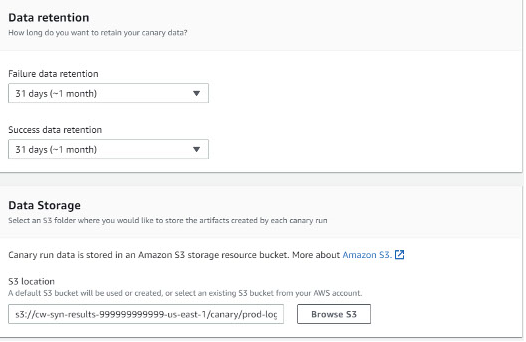
CloudWatch Alarms
Under the Alarms section, you can specify whether you want to create default CloudWatch alarms for a canary. If you choose to create alarms, they use the naming convention: Synthetics-Alarm-canaryName-index
CloudWatch Metrics by the Canaries
Canaries publish the following metrics to CloudWatch in the CloudWatchSynthetics namespace:
| Metric | Description | Units |
|---|---|---|
| SuccessPercent | The percentage of the runs of the canary that succeed and find no failures. | Percent |
| Duration | The duration of the canary run. | Milliseconds |
| 2xx | The number of network requests within 200 and 299 response codes performed by the canary that returned OK responses | Count |
| 4xx | The number of network requests within 400 and 499 response codes performed by the canary that returned Error responses | Count |
| 5xx | The number of network requests carried out by the canary that returned Fault responses, with response codes between 500 and 599 | Count |
| Failed | The number of canary runs that was unable to execute. | Count |
| Failed Requests | The number of HTTP requests performed by the canary on the target website failed with no response. | Count |
| VisualMonitoringSuccessPercent | The percentage of visual comparisons that successfully matched the baseline screenshots during a canary run | Percent |
| VisualMonitoringTotalComparisons | The total number of visual comparisons happened during a canary run. | Count |
How to Create Canaries with Broken Link Checker
Now, let’s walk through a real-world use case for CloudWatch Synthetics: detecting broken links.
Broken links can negatively impact customer experience and lead to lost business. There are multiple reasons for broken links on websites, including:
- A linked website is no longer available.
- A linked website’s webpage was moved without the creation of a redirect.
- The URL of a linked website was changed.
- The content, such as images, videos, and PDFs, has been deleted.
However, regardless of the root cause, detecting and correcting broken links can improve overall user experience. Here, we will walk through a step-by-step process to create a canary that proactively checks for broken links on a sample website (https://www.myWebsite.com) .
Solution Overview
Canaries can crawl your website, detect broken links, and find the reason for failure. CloudWatch Synthetics also creates a detailed JSON report in an Amazon Simple Storage Service (Amazon S3) bucket, making fixing the broken links a quick and hassle-free process.
Prerequisites
- Provide an initial source of the website ( https://www.myWebsite.com, in this case)
- Enter the maximum number of links to be checked (10, in this case)
Expected Outcome
The canary script that monitors our endpoints crawls the website. The logs give information about the broken links if the canary fails. The canary starts at the source URL and collects all the links on the source page, and then tries to reach all of the connected links until the link limit is reached. CloudWatch Synthetics takes screenshots at the start and end of every link checked.
CloudWatch Synthetics then generates a broken link checker report named BrokenLinkCheckerReport.json and stores it in an Amazon S3 bucket specified during the anary creation, with the following information about every link checked:
- Source URL
- Destination URL
- Anchor text on the source URL
- Status code returned by the destination URL
- Description of the error, if any
- Screenshots taken based on the screenshot configuration setting
An HTTP Archive (HAR) is also generated to log details about every link visited.

Creating Canary Tests
- Go to the AWS CloudWatch Console and click Synthetics Canaries under Application Monitoring. Then click Create canary.
- Select “Use a blueprint” radio button and select the Broken Link Checker.
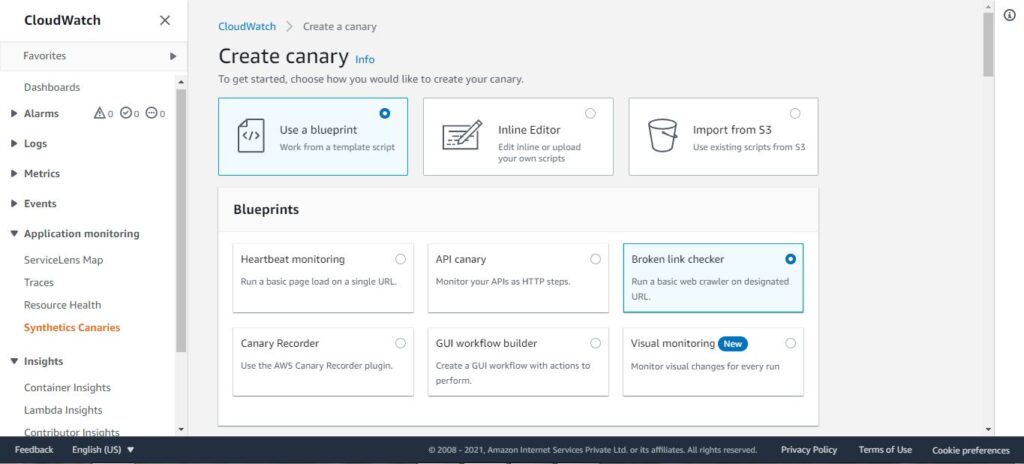
- In the Canary builder section, specify a Name for the canary and specify the Application or endpoint URL of your website. Also, set the Maximum number of links and select ‘Take screenshots’
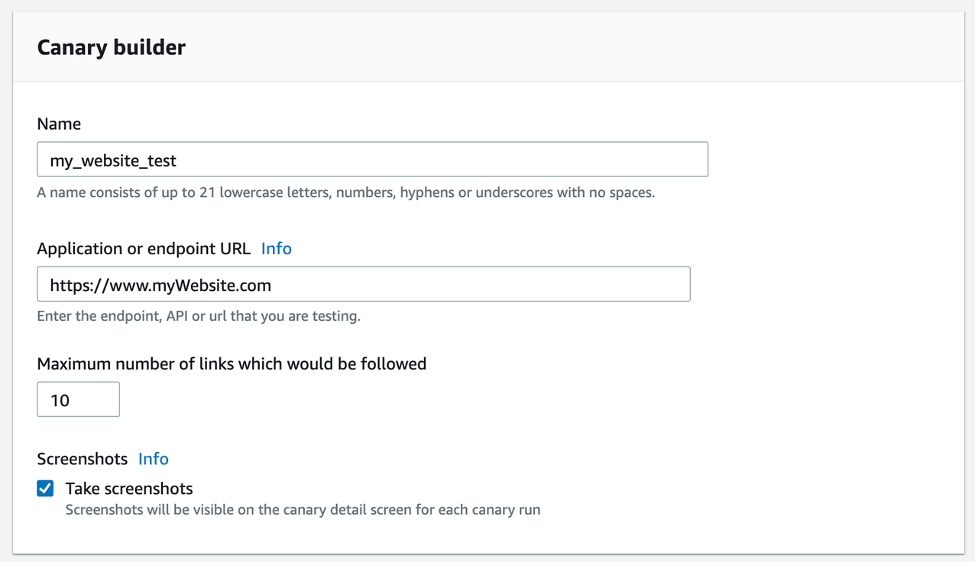
Inputs required to add a name, application or endpoint URL, and max number of links to be followed in the canary builder section of AWS CloudWatch Console. (Image Source).
- Based on the Broken Link check blueprint, CloudWatch Synthetics automatically generates the script used for canary runs.
- You can configure other parameters such as Schedule, Data Retention and Storage, Access permissions, and more as per your needs.
- Click Create Canary. AWS CloudWatch Synthetics may take 1-2 minutes to provide the resources needed for the canary runs.
Results
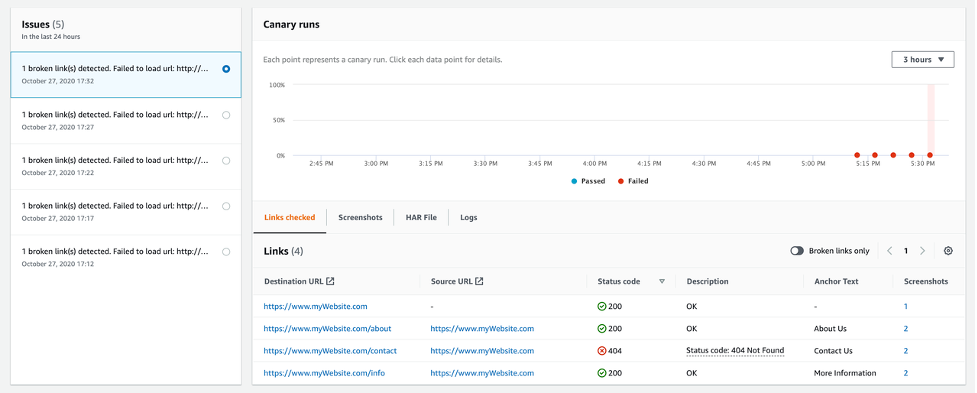
- The canary tries to load and capture responses for the links (https://www.myWebsite.com/about, https://www.myWebsite.com/info, and https://www.myWebsite.com/contact).
- Four links are checked (the source link and the three child or sub-links). The canary fetches URLs from the successfully loaded child pages until the link limit is reached.
- In the below screenshot, there are four links shown under Links checked. The third link in the list returned with a failed status code of 404.
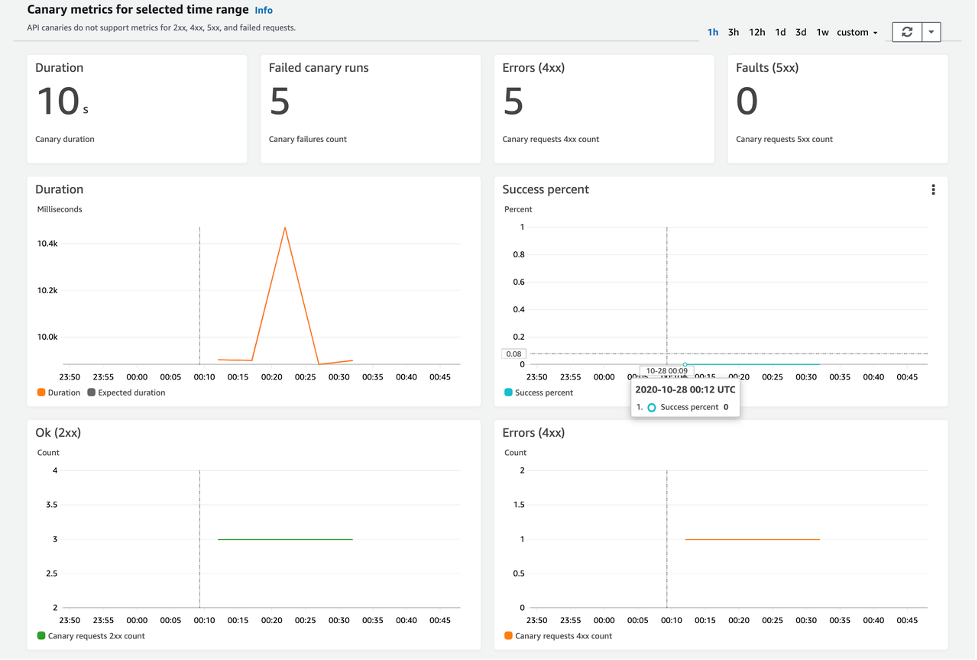
CloudWatch Synthetics pushes the following Canary metrics:
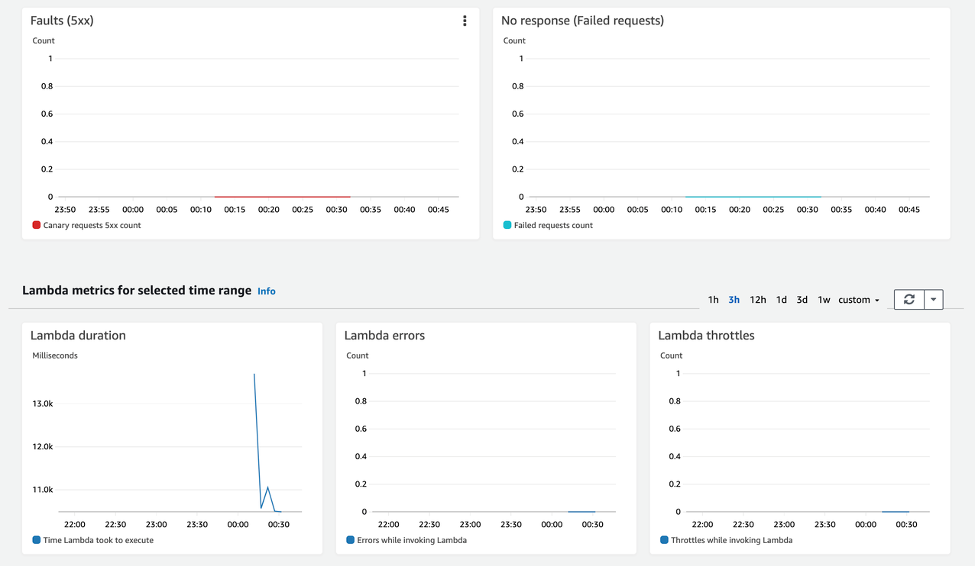
Following are the Lambda metrics:
Below JSON Report is created and stored in an S3 bucket along with screenshots:
{
"links": {
"https://www.myWebsite.com": {
"linkNum": 1,
"url": "https://www.myWebsite.com",
"text": "",
"parentUrl": "",
"status": {
"statusCode": 200,
"statusText": "OK"
},
"failureReason": "",
"screenshots": [
{
"fileName": "01-source.php-succeeded.png",
"pageUrl": "https://www.myWebsite.com/",
"error": null
}
]
},
"https://www.myWebsite.com/about": {
"linkNum": 2,
"url": "https://www.myWebsite.com/about",
"text": "About Us",
"parentUrl": "https://www.myWebsite.com",
"status": {
"statusCode": 200,
"statusText": "OK"
},
"failureReason": "",
"screenshots": [
{
"fileName": "02-about.php-sourcePage.png",
"pageUrl": "https://www.my_website.com",
"error": null
},
{
"fileName": "05-about.php-succeeded.png",
"pageUrl": "https://www.myWebsite.com/about",
"error": null
}
]
},
"https://www.myWebsite.com/contact": {
"linkNum": 3,
"url": "https://www.myWebsite.com/contact",
"text": "Contact Us",
"parentUrl": "https://www.myWebsite.com",
"status": {
"statusCode": 404,
"statusText": "Not Found"
},
"failureReason": "Status code: 404 Not Found",
"screenshots": [
{
"fileName": "03-contact.php-sourcePage.png",
"pageUrl": "https://www.myWebsite.com/about",
"error": null
},
{
"fileName": "06-contact.php-failed.png",
"pageUrl": "https://www.myWebsite.com/contactUs",
"error": null
}
]
},
"https://www.myWebsite.com/info": {
"linkNum": 3,
"url": "https://www.myWebsite.com/info",
"text": "More Information",
"parentUrl": "https://www.myWebsite.com",
"status": {
"statusCode": 200,
"statusText": "OK"
},
"failureReason": "",
"screenshots": [
{
"fileName": "04-info.php-sourcePage.png",
"pageUrl": "https://www.myWebsite.com",
"error": null
},
{
"fileName": "07-info.php-succeeded.png",
"pageUrl": "https://www.myWebsite.com/info",
"error": null
}
]
}
},
"brokenLinks": [
"https://www.my_website.com/contactUs"
],
"totalLinksChecked": 4,
"totalBrokenLinks": 1
}
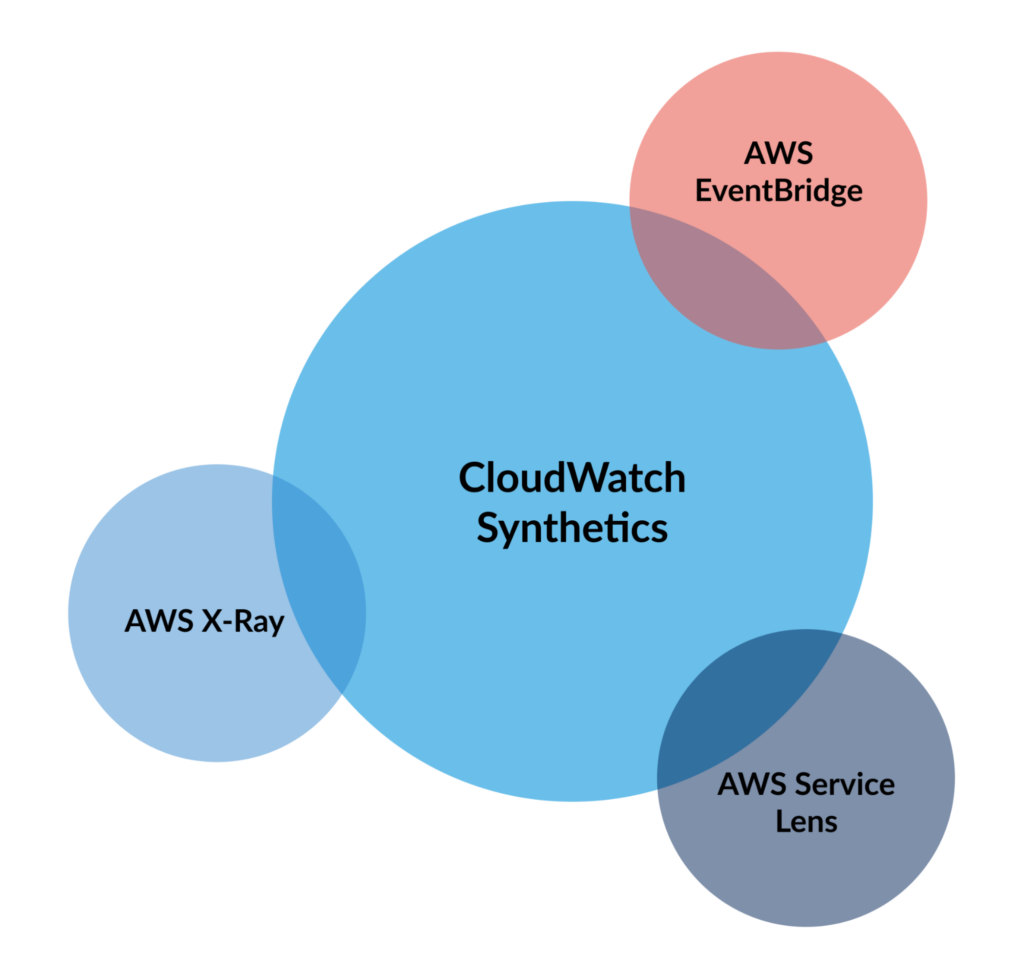
}Integration: AWS Synthetics and AWS Services
We can use several AWS services in conjunction with canaries to enhance their capabilities. Here, we will focus on AWS EventBridge, AWS X-Ray and AWS Service Lens only.
Canaries and AWS EventBridge
EventBridge is an AWS service that delivers a near-real-time stream of system events, describing AWS Services changes. You can use AWS EventBridge event rules to monitor your Canary Events. CloudWatch Synthetics sends almost all events to AWS EventBridge. Prerequisites for creating EventBridge rule for CloudWatch Synthetics are:
- Familiarity with Events, Rules, and Targets in EventBridge
- Configure the targets invoked by your EventBridge rules. Rules can invoke multiple targets such as :
- Amazon SNS topics
- AWS Lambda functions
- Kinesis streams
- Amazon SQS queues
You can read more about AWS EventBridge here. You can also use Monitoring Canary Events official documentation to get started.
Canaries and AWS ServiceLens
AWS CloudWatch ServiceLens enables you to visualize the performance and availability of your entire application by unifying metrics, logs, traces, and canaries to provide a holistic view in one place. A unified view is beneficial for observing highly distributed microservices-based applications. AWS ServiceLens is available in all public AWS Regions where AWS-X-Ray is available. To use ServiceLens, you must enable the X-Ray agent in your AWS environment.
To learn more, see CloudWatch Synthetics and ServiceLens.
Canaries and AWS X-Ray
We can analyze and debug our microservices and serverless architecture-based applications using AWS X-Ray. It collects and records traces, which are data gathered from each service. AWS X-Ray uses ServiceMap to see latencies, HTTP statuses, and metadata for each service. You can use AWS X-Ray to trace ‘canary runs’ and determine the root cause of failures. You need to enable ‘tracing’ while creating canary to use the AWS X-Ray service. Canaries with tracing ‘enabled’ appear on the ServiceMap in both CloudWatch ServiceLens and AWS X-Ray. You can read more on Canaries and X-Ray Tracing here and AWS X-Ray resources here.
Conclusion
AWS CloudWatch Synthetics is a powerful synthetic monitoring service. Canaries and integrations with other AWS services make CloudWatch Synthetics highly extensible as well. When configured properly, CloudWatch Synthetics can be an effective tool for proactively monitoring end-user experience on your web apps. However, transaction emulation is only one small part of a complete hybrid cloud monitoring strategy that must include integration with dozens of technologies, a single pane of glass, intelligent event correlation, and automated action taking. Sign up for a OpsRamp demo to evaluate the power of a comprehensive hybrid cloud monitoring solution.
You like our article?
Follow our monthly hybrid cloud digest on LinkedIn to receive more free educational content like this.