AWS X-Ray is a distributed application tracing service consisting of an Application Programming Interface (API), Software Development Kit (SDK), dashboard, and integrations with other AWS monitoring tools. It supports multiple programming languages to show a map of your application’s underlying components. Operations teams commonly use it along with CloudWatch, ServiceLens, and Synthetics to help isolate the root cause of AWS-hosted application slowdowns or outages along various application transaction paths.
In this article, we will look at how X-Ray can help you maintain your AWS-based applications, how to get started and consider X-Ray’s strengths and weaknesses.
AWS X-Ray Features Summary
| Feature | Description | Strengths / Limitations |
|---|---|---|
| Trace mapping | Deep visualization of how individual requests make their way through your architecture, including performance and failure details | Easy to navigate and filter, allowing you to sift through relevant information. |
| Trace details | Breakdown of a request journey into individual components, with timing details, custom metadata, and error logs | Instrumented calls capture code exceptions and make them easy to find here, alongside any custom data you want to pass from your code. |
| Service mapping | Visualization of the components in your architecture and how traffic moves between them | The automatically generated service map contains failure and performance metrics to enhance your insight into your system. Filtering by time and custom annotations is a powerful tool for incident management. |
| Trace shipping | Traces are sent to AWS, where they can be queried and retrieved | The free tier provides a monthly allowance of free storage and retrieval. |
| Instrumentation support | SDKs are provided for Java, .NET, Python, Ruby, Go, and Node.js | Java gets a lot more attention from the AWS documentation than other languages. Most of the SDKs are managed as open-source projects. The CLI and API are available if there is no SDK for your language of choice. |
| OpenTelemetry support | Applications on AWS can be instrumented for X-Ray and other tools simultaneously. | Support exists in AWS Distro for OpenTelemetry, which comes with a separate set of SDKs and different deployment requirements. |
| APM integration | Popular APMs offer integrations that import X-Ray data by polling the API | Adding tracing data to an integrated suite of monitoring, logging, and process management functionality can promote high operational efficiency.The polling approach can make these integrations less responsive than other tracing solutions. |
| X-Ray Daemon | A necessary component that collects segment data and manages the connection to AWS X-Ray | Automatically provisioned for several AWS compute solutions like Lambda, but not for EC2. |
| Insights | Artificial intelligence to detect anomalies and automatically report on incidents | No system-specific configuration is needed. Insights integrates with several AWS messaging options to provide notification and automated response options. |
| Setup & Documentation | Several automatic instrumentation options are available for Java applications. A sample application is available and several language SDKs are open source projects | AWS documentation is strong on how features work and providing examples but light on higher-level operational management and best practice configuration. |
Why Tracing?
As an operations engineer or manager responsible for a complex software system, you care about having a relevant view of your system that allows you to focus fast on the components that matter whenever there’s an incident.
Tracing and the tools that it enables give you this functionality. Instead of using heuristics, custom log messages, and trial and error to find where a request went wrong in the stack, requests leave behind traces that give you a complete picture of the full request journey in the transaction path.
This feat is achieved by creating a unique trace id as early as possible in the request lifecycle and propagating that id through every component involved in serving that request. Each component reports what it sees to a central service such as X-Ray, which reconstructs the whole picture by matching reports bearing the same trace id.
Why X-Ray?
Standards and tools for tracing and telemetry have made great progress over recent years. AWS X-Ray gives a great combination of a quick start, quick discovery and deep/relevant visualization, insights into AWS and integration with key AWS services out of the box, and optional integration with open standards. It’s also able to fit into a more holistic strategy suitable for fast-paced operations departments.
You might want to look beyond X-Ray (such as Jaeger Tracing) if you have strong internal open source capabilities, use multiple cloud providers or on-prem solutions, or for some unusual use-cases or specific customization needs. Even here, you might choose X-Ray as an initial solution that’s easy to use.
AWS X-Ray Integrations
AWS X-Ray integrates with whichever AWS compute options you’re using – EC2, ECS, EKS, Lambda, and supports tracing through its messaging services SNS, SQS, and EventBridge, and its service mesh AWS App Mesh. The integration that was notably absent previously, Amazon API Gateway, is now available. Aside from these out-of-the-box integrations, X-Ray has options for working with generic HTTP and SQL clients.
Level of Change Needed
How much you need to change your code varies by language and component. For Java code on an EC2 instance making AWS SDK and SQL calls, you can instrument your code entirely through build and application configuration, and outgoing HTTP calls can be traced by swapping in an AWS version of HTTPClientBuilder. You can find the details in this documentation.
Manual code changes are needed in any language to add custom data to trace segments, including custom grouping of calls, and any annotations and metadata you want to add.
Whether automatic or manual, changes to X-Ray tracing will require an application restart or redeployment.
Using AWS X-Ray
AWS provides two sample applications. A Node.js application can be deployed from the AWS X-Ray management console, and a Java application “Scorekeep” is described in detail in the X-Ray documentation.
This section will use the Scorekeep tutorial to highlight what you can get out of AWS X-Ray. AWS documentation takes you through it step by step; here, we will focus on the concepts and instrumentation, which is what you will need to trace your applications.
Tracing is very simple at heart but has its concepts that you will need to understand. Before getting hands-on, here are the main tracing terms you will see:
| Segment | Like a method call, a segment represents a unit of activity over a specific period of time, from the point of view of a single component. For example, a request in a simple web application can generate segments from the point of view of the client, the webserver, and the database. |
| Trace | Tracing works by injecting a unique identifier into a request, and including that identifier whenever a segment related to that request is recorded. AWS X-Ray groups segments with the same identifier, forming a trace. If your system is fully instrumented, a trace can describe the whole lifecycle of a single request. |
| Subsegment | A single component may divide a segment into subsegments, in a similar way to a method calling other methods before returning. The distinction between segments and subsegments is primarily related to the component boundary, and you will find the same data types attached to each. Subsegments can be nested, and let you send more granular, structured data to X-Ray. AWS X-Ray has a useful feature in creating inferred segments from subsegments. |
| Sampling | In some cases, recording traces for 100% of your traffic across all your components is unnecessary, as a small random sample can give you enough context to see how your system is operating, and you won’t want high-performance components spending cycles on tracing for every request. In other cases, you want to trace everything with fine granularity to avoid blind spots. Sampling rules let you control the proportion of requests you collect traces for. |
| Annotations & metadata | If you want to analyze your trace data by anything other than the component and line of code responsible for collecting the trace, you can add custom information to segments and subsegments. For example, you could annotate calls with the user id or the caller, and be able to see later that an incident only affects calls from certain users. Annotations are indexed for searching, while metadata is available but not searchable. You can also add a user id, which can only be scoped to a segment (not a subsegment). |
The Scorekeep example uses Elastic Beanstalk and includes Lambda functions. In general, the differences in X-Ray design between the different compute environments are minor, and AWS documentation covers the considerations needed for more complex Lambda, ECS, and EKS environments.
After Deployment
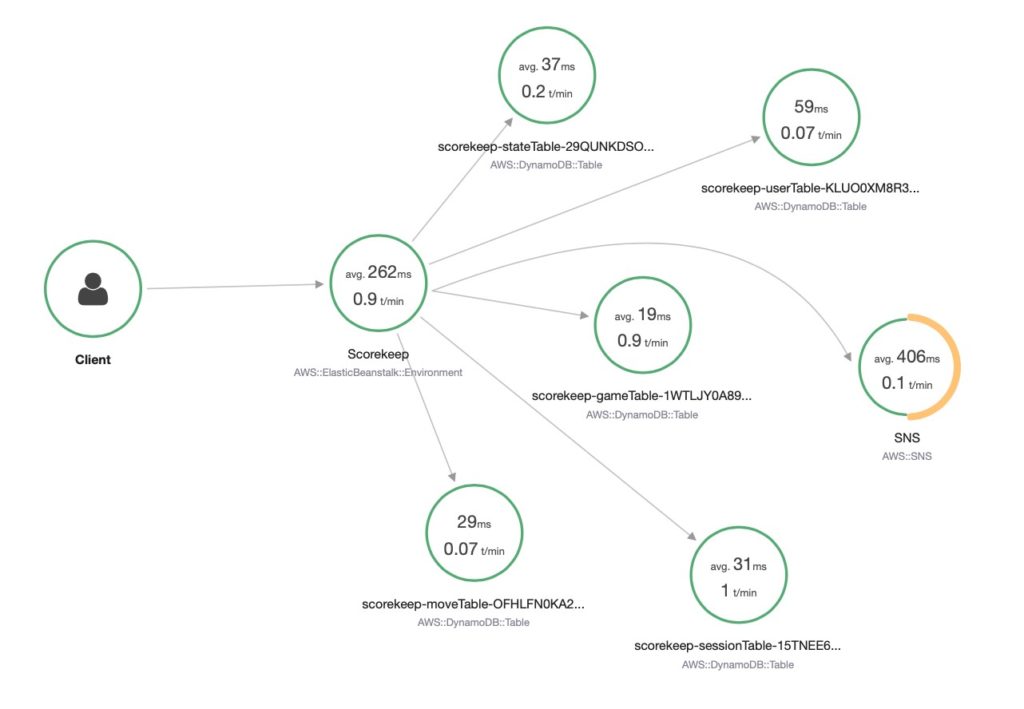
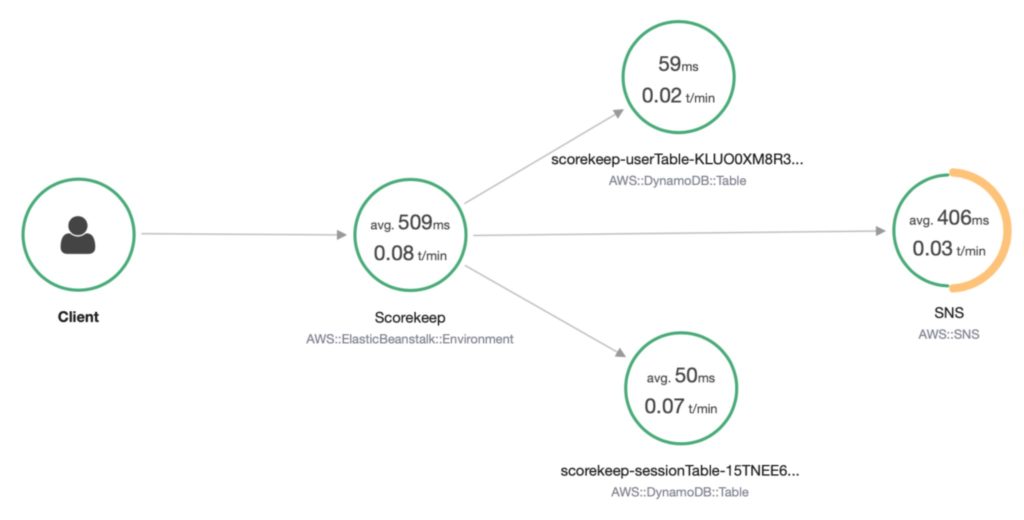
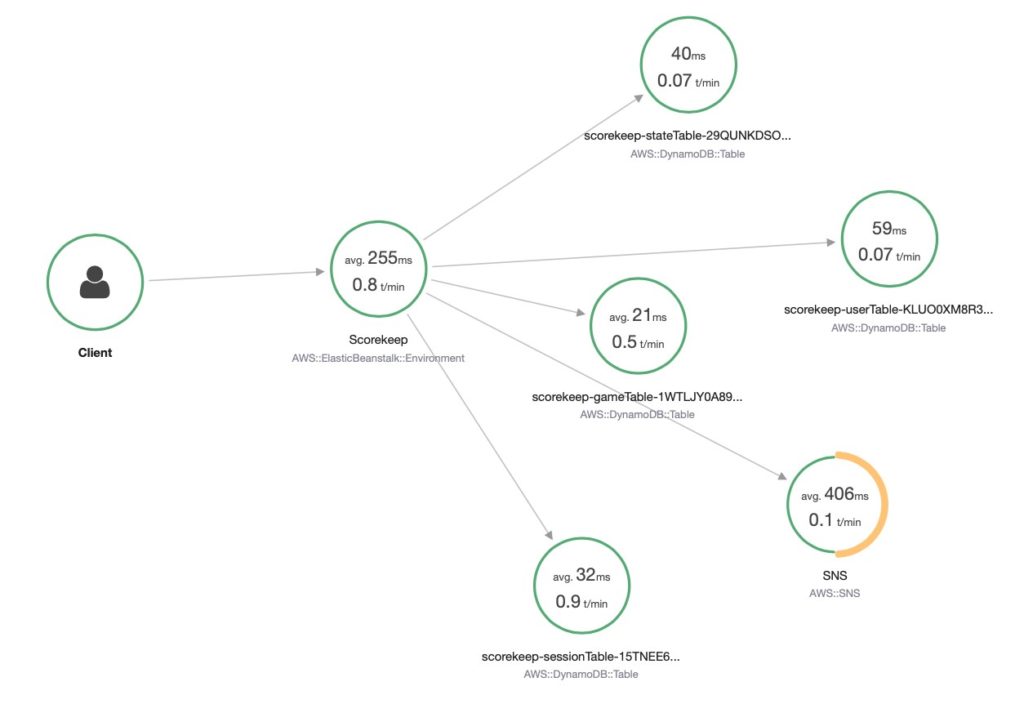
Once the CloudFormation stack deployment has been completed, you can access the web application. You can get a feel for X-Ray working by interacting with the application slowly and reviewing what can be seen in the X-Ray console after each interaction. You will see each group of components appear on the service graph as you access the parts of the application that use them.
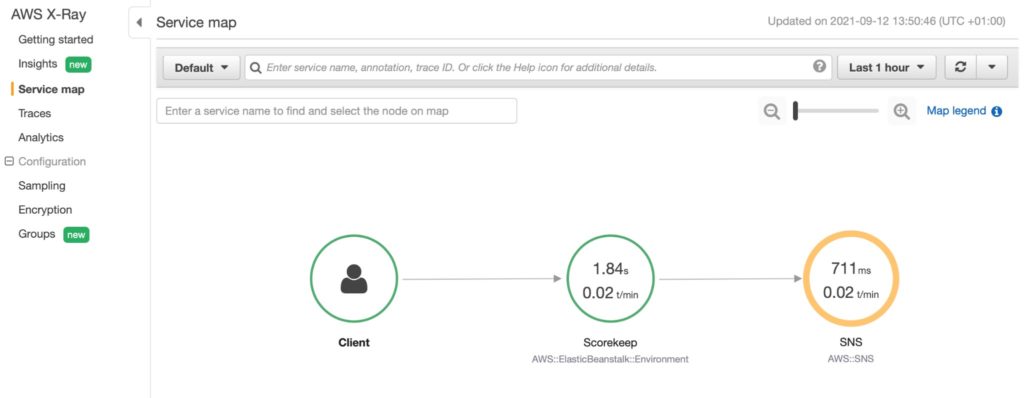
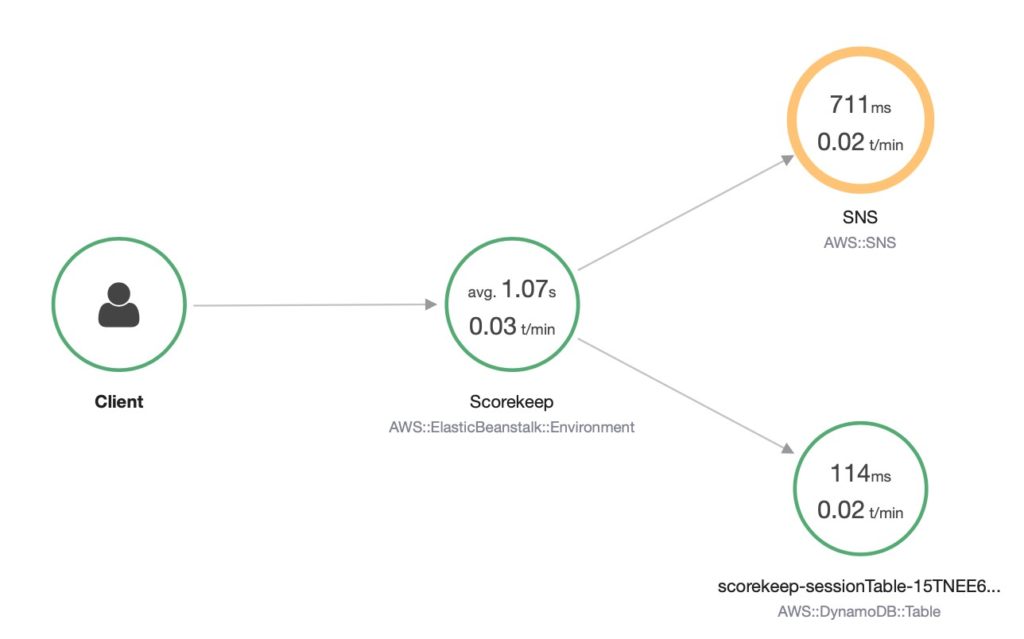
The Scorekeep example is written with a deliberate error so that you can see how X-Ray allows you to detect the issue and pinpoint the component at fault. In this case, the stack trace attached to the SNS segment is enough to locate and diagnose the code fault. More generally, you can quickly answer a range of diagnostic questions from the service graph view:
- Is there a failure or a performance issue?
- What proportion of requests are affected?
- When did the failure/performance pattern change?
These questions take a lot longer to answer using only simple monitoring and logging tools. Thus, tracing can directly improve key operational success metrics like Mean Time To Recovery (MTTR).
Other console features include:
- Histograms: showing the latency distributions for each node and edge in a service map
- Groups: a saved filter you can use with service maps and traces
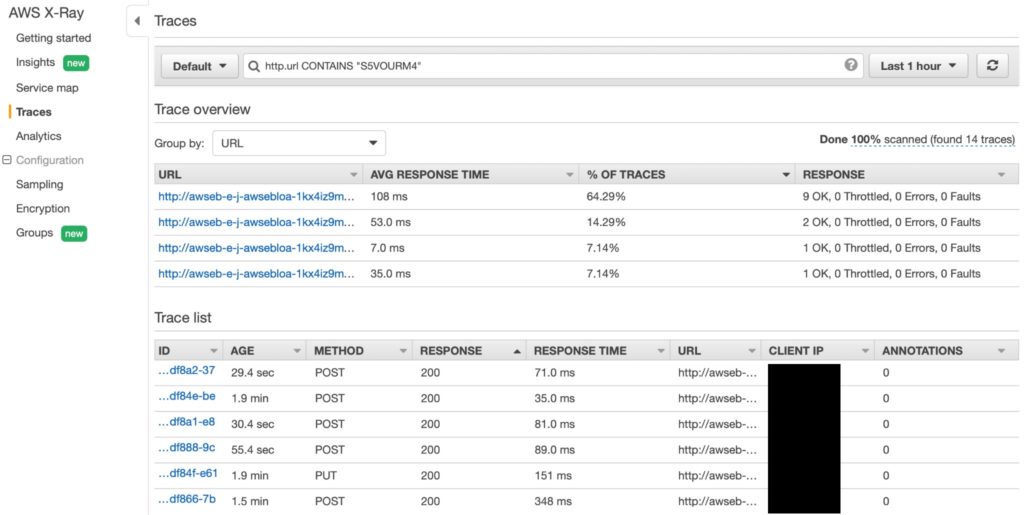
- Analytics: supporting more detailed examinations of trace data
- Insights: using automated analysis to raise issues and create notifications when it detects anomalies

AWS X-Ray Instrumentation
From an application already configured to work with X-Ray, here are minimal examples for tracing individual methods in Java, Python, and Ruby:
public void parentMethod() {
  Subsegment subsegment = AWSXRay.beginSubsegment(“Synchronous Java subsegment”);
  tracedMethod();
  AWSXRay.endSubsegment();
}
def parent_method():
  subsegment = xray_recorder.begin_subsegment(‘Synchronous Python subsegment’)
  traced_method()
  xray_recorder.end_subsegment()
def parent_method
  subsegment = XRay.recorder.begin_subsegment name: ‘Synchronous Ruby subsegment’
  traced_method
  XRay.recorder.end_subsegment
end
We can see that only a small amount of code is needed to send a single segment to AWS X-Ray. However, this is still an unwanted maintenance burden, as it both distracts from your application logic and creates an extra vector for human error. Unlike traditional debugging, you want tracing in place before your application breaks. You want to consider instrumenting your whole application rather than targeting individual methods to get the most value from tracing. This is why patterns like aspect-oriented programming and configuration- or servlet-driven instrumentation are welcomed in languages where they are available, all keeping a separation between application logic and operational needs.
Here is how we would add annotations, metadata, and a user id in Java:
public String uid = “User123”;

public void send_trace(String domain, int quantity) {
  Subsegment subsegment = AWSXRay.beginSubsegment(“Synchronous annotated Java subsegment”ᐦ);
  tracedMethod();
  subsegment.putAnnotation(“domain”, domain);
  subsegment.putAnnotation(“quantity”, quantity);
  subsegment.putMetadata(“custom”, “metadata goes here”);
  # User ID cannot be added to a subsegment
  AWSXRay.getCurrentSegment().setUser(uid);
  AWSXRay.endSubsegment();
}
AWS X-Ray Pricing and limits
AWS X-Ray pricing is based on traces being recorded, retrieved, and scanned.
- Recorded: a trace is stored by AWS X-Ray
- Scanned: a trace is included in a query from the management console or API
- Retrieved: the full data of a trace is retrieved by an API call
A maximum size per trace of 500 KB sets a theoretical limit on how much you can add through annotations and metadata and how many components a request can fan out.
Traces recorded, scanned, and retrieved are covered by monthly free tier allowances and then billed in batches of 1 million. AWS recommends using your request volume and desired sampling rate to project your recorded tracing volume.
If X-Ray Insights is enabled, this is also billed per million traces, with no free tier allowance.
You can view your utilization of traces stored and retrieved using AWS Cost Explorer – look for TracesStored and TracesAccessed under the Usage Type filter. There is currently no built-in reporting of trace size, but you can retrieve traces and segment documents using the API to get a rough estimate.
Traces are retained for 30 days. Exporting trace data is weakly supported by the X-Ray API (integrations with APM solutions typically use a slow polling technique, retrieving traces in batches). Note that the typical use cases for tracing are short-term, as logging and monitoring generally provide enough context at a lower storage cost for long-term use.
AWS X-Ray Key Considerations
Initial Configuration
It’s important to know that the leading third-party commercial Application Performance Management (APM) tool vendors include automatic and dynamic instrumentation, working through a discovery mechanism, and requiring no code changes (as does X-Ray). The same tools also support a wider range of programming languages than X-Ray. Some offer integrations at the kernel or virtual machine level that enable some degree of language-agnostic tracing, similar to using tools like strace at the OS level. If you are reluctant to change your source code, you should consider third-party paid APM tools.
Third-Party Code
It’s worth noting that the AWS documentation captures a couple of advanced cases where instrumentation can be more problematic – in startup code and in multithreaded applications.
This issue raises a wider question of how you handle and monitor for failures in the instrumentation calls themselves. Moreover, if you’ve instrumented code that you don’t own, your application support teams won’t know how to handle the failure scenarios. The best approach to mitigate this type of risk is to keep most of your instrumentation lightweight, separated, and automated where possible.
Open Source Alternatives
In recent years, the open-source community has created alternative solutions for application tracing. Two of the popular projects are Jaeger and Zipkin and are worth reviewing before adopting a tracing tool.
Integrated Monitoring Platform
Tracing is only one feature of a larger monitoring strategy that must include infrastructure monitoring, machine learning, and automation. The consolidation and integration of monitoring tools supporting both public and private cloud environments enable the promise of reducing mean time to resolution (MTTR) by identifying root causes of application problems more quickly across silos. The OpsRamp platform is designed to consolidate tooling and enable integration by offering an open platform that delivers hybrid infrastructure discovery and monitoring, event and incident management, and remediation and automation.
Conclusion
If you’re not currently using tracing, AWS X-Ray is a fast and simple way to get a new level of insight into your systems and AWS services, whether you want to understand more about your traffic profile and bottlenecks or better information for observability and debugging.
If you’re a service owner and want to improve your operational metrics, tracing observability allows your engineers to zero in on root causes faster and integrate monitoring and logging data as part of your wider operational strategy.
You like our article?
Follow our monthly hybrid cloud digest on LinkedIn to receive more free educational content like this.
Consolidated IT Operations for Hybrid Cloud
Learn MoreA single platform for on-premises and multi-cloud environments
Automated event correlation powered by machine learning
Visual workflow builder for automated problem resolution