Prometheus came to prominence as a free tool for monitoring Kubernetes environments. And at its heart, Prometheus is an on-disk Time Series Database System (TSDB) that uses a standard query language called PromQL for interaction.
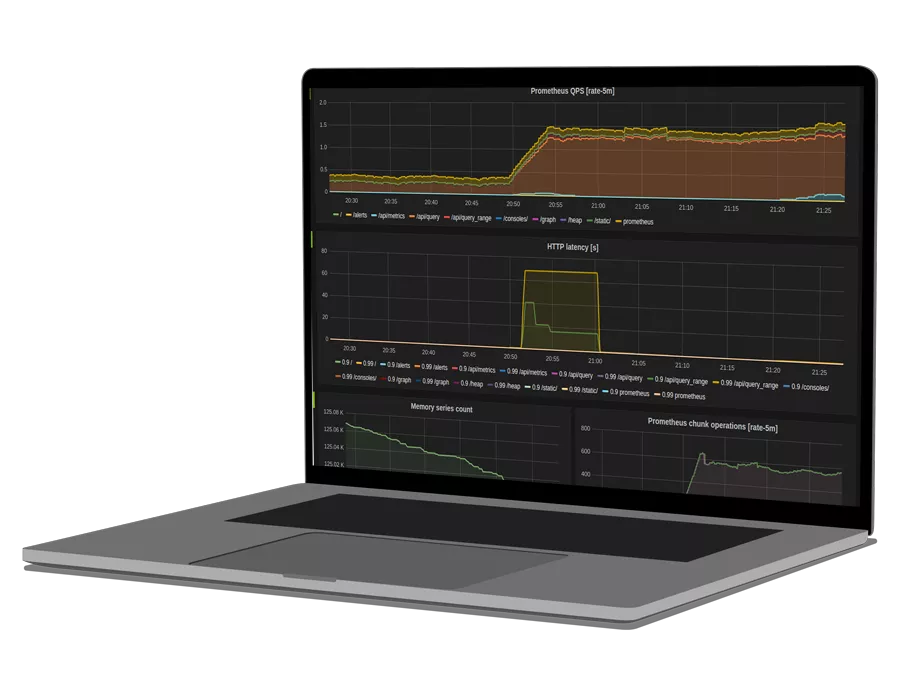
You can run PromQL queries using the Prometheus UI, which displays time series results and also helps plot graphs. You can also use PromQL to create dashboards using the collected data and point it to an instance of Grafana or a hosted monitoring tool such as OpsRamp that natively supports PromQL.
In this article, we’ll help prepare you to use PromQL to enhance your monitoring. Let’s get started.
Key PromQL Concepts
Metric Labels
PromQL relies heavily on Metric Labels for filtering. A label is a key-value pair that defines a new time-series. For example, you may have a metric that simply counts the number of API requests (e.g., api_http_requests_total). You may then use labels such as operation=create or operation=update to define two separate time-series for the create API operation versus the update API operation, and filter each separately for graphing.
Metric Types
Prometheus supports 4 main metric types, which can be broadly classified on how they behave over time.
| Metric Type | Description |
|---|---|
| Counter | Cumulative metric representing a single increasing value |
| Gauges | Single numerical value which can either increase or decrease |
| Histograms | Samples values and counts them in configurable buckets |
| Summaries | Samples values and also provides sum and total counts |
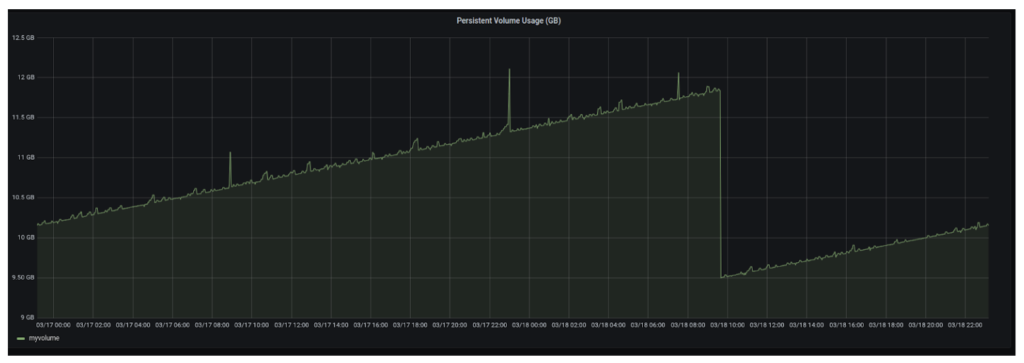
For illustration, we might want to use a gauge to monitor a persistent volume being used by an elasticsearch data pod inside a kubernetes cluster called kubelet_volume_stats_used_bytes.
Data Types
In order to correctly represent the metric types previously mentioned, PromQL offers the following 4 data types:
| Instant Vector | A set of time series containing a single sample for each time series, all sharing the same timestamp |
|---|---|
| Range Vector | A set of time series containing a range of data points over time for each time series |
| Scalar | A simple numeric floating point value |
| String | A simple string |
For illustration, we might want to use a range vector to return a total of HTTP requests from a specified time range. A metric such as http_requests_total{job="myserver"}[5m] returns a range of values for the total http requests over the last 5 minutes
Query Operators
Operators enable you to work with metrics and data types. The following operators are available for PromQL:
| Arithmetic Binary | + , – , * , / , % , ^ |
|---|---|
| Comparison Binary | == , != , > , < , >= , <= |
| Logical Binary | and , or , unless |
| Vector Matching | group_right , group_left |
| Aggregation Operators | sum, min , max , avg |
For illustration, you might want to know the total memory being used by a pod. The following provides a scalar value for working memory in your pod: sum(container_memory_working_set_bytes{pod="mypod"}).
Functions
Functions help you avoid needing too many operators when running queries. The following functions are available for PromQL:
| Function | Description |
|---|---|
| count() | Returns count of total time series |
| vector() | Returns the scalar as vector with no labels |
| rate() | Calculates the per-second average rate of increase of the time series in the range vector |
| increase() | Increases specified time series in the range vector |
| time() | Returns number of seconds since January 1, 1970 UTC |
| delta() | Returns difference between the first and last value of each time series element |
| <aggr>_over_time() | Aggregates each series of a given range vector and returns an instant vector with per-series aggregation results, used with sum, avg, min, max and more |
For illustration, you might want to know the restart rate for a container in a specific pod (kube_pod_container_status_restarts_total). The following uses the increase function to provide the pod container’s total restarts:
increase(kube_pod_container_status_restarts_total{pod="$Pod",conta
iner="$container",container!=""}[1h])
See how OpsRamp enhances Prometheus in minutes with Prometheus Cortex
Deep Dive in PromQL
A Closer Look at Metric Labels
Prometheus is used in large scale deployments to monitor infrastructure and workloads of all sizes and complexity. As a result, Prometheus collects a lot of metrics that you don’t necessarily need all of the time. You can filter those extra metrics out using PromQL. In order to simplify by filtering, we need to understand how to use metric labels.
Prometheus adds labels to the values of each time series. These labels can be used to narrow down the results to the exact subset you want to analyze.
Let’s look at a couple of scenarios where we want to analyze the scraped kube state metrics from a deployed kubernetes cluster.
Scenario 1: Find all Running Deployment Replicas
Say you want to find all currently running deployment replicas (kube_deployment_status_replicas). If you run this query, you will get all matching time series available, as shown in the following screenshot.
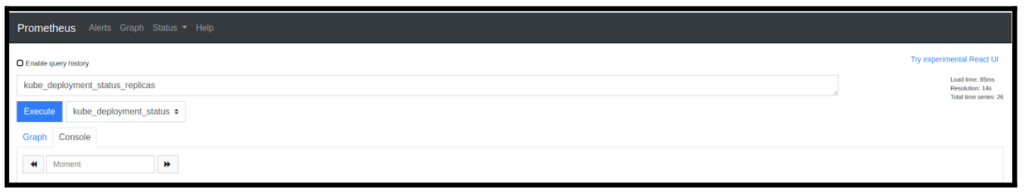
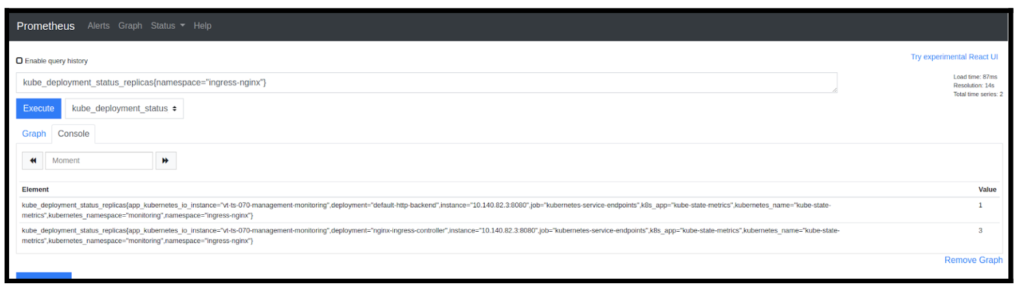
Notice the Total time series returned is 26. Now, suppose you need to narrow down your results to a particular namespace (e.g., Nginx-ingress-controller). To do so, simply run the following:kube_deployment_status_replicas{namespace="ingress-nginx"}
Now, your results return only deployments running in the specified ingress-nginx namespace (in this case example, it’s 2 in total).
Scenario 2: Find Total Container Restarts From a Deployment
Suppose you want to look at total container restarts for pods of a particular deployment or daemonset. To return these results, simply filter by pod name. kube_pod_container_status_restarts_total{pod=~"filebeat.*"}
It should be noted that we used =~ instead of = like we did in the previous example. This is because we wanted to filter for all the pods which just start with the name filebeat.
Similarly, if you want to review container memory usage for all containers except for those with the filebeat prefix, all you need to do is this:container_memory_working_set_bytes{container!~"filebeat.*"}
As you can see, labels are great for grouping and matching metrics based on any number of dimensions.
Scenario 3: Define SLAs/SLOs for Customer Facing Applications
As a service provider, you may guarantee that “99.99% of the time, your site will be up and running”.
To translate to a concrete example, imagine that you are responsible for the monitoring of an ecommerce site that sells Rubik’s cubes. Your internal stakeholders agree that the SLA should be that for 99.99% of the time, the website is up and available for customers to purchase Rubik’s cubes, leaving you a .01% error budget. Stated alternatively, for a given year, which is roughly 525600 minutes, you can allow for 52.56 minutes, or about an hour of app downtime.
To fulfill this agreement, you need to understand what it means for your website to be up. In other words, you need to define your service level objectives (SLO) that will fulfill your SLAs. Oftentimes, tracking the client side requests is a good way to understand a service’s health. If the 404 (client side) errors start increasing as a percentage of all client requests, this may be a symptom of a degrading service, and something that will directly impact your SLA.
In PromQL, you could express this as follows:
sum(kube_rest_client_requests{instance=~.*404.*})/sum(kube_api_rest_client_requests_total)
Diving the total rest client requests by only those that are sending a 404 provides a percentage value that can be monitored proactively to ensure that SLAs are upheld.

Learning the Metric Types
Prometheus Counters
According to the Prometheus documentation, a Counter is a “single, monotonically increasing, cumulative metric.”
Now, what does that mean? “Single metric” means that a Counter represents a single value (e.g., the number of orders created in a shop system). “Monotonically increasing” just means that it can only increase (typically by one at a time). Finally, a “cumulative metric” is a metric that always contains the overall value (e.g., total_orders in your shop system might count total orders ever processed).
The most common functions used with counters are rate() and increase().
rate() calculates the per-second average rate of increase of the time series in the range vector. It is important to understand that the rate() function accounts for counter resets. This means that in a scenario where a process restarts, rate() simply adjusts the metric accordingly. When a counter appears to decrease, rate() assumes there was reset.
<i>increase()</i> is basically syntactic sugar for rate(v), multiplied by the number of seconds under the specified time range window. This function should only be used for moments when human readability is important. Use rate()in recording rules so that increases are tracked consistently on a per-second basis.
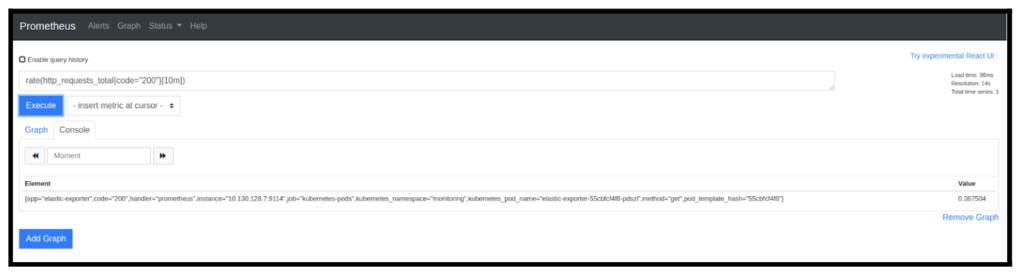
Let’s look at the counter metric http_requests_total, which is exposed by a http server for receiving https requests. This metric only goes up with time (monotonically increasing), since the total number of requests sampled at any moment of time will be either the same or more than the last sample. However, it is very important to understand that the number of requests in the moving time window could be less than the previous sample of that window. Therefore, in order to effectively graph this metric, we would use the rate() function like this:
Let’s look at another example where we want to measure the increment in container restarts running inside a particular pod, using a metric named kube_pod_container_status_restarts_total (which is exposed by kube-state-metrics). This can be easily plotted using the following query in any dashboard that supports PromQL such as Grafana or OpsRamp.increase(kube_pod_container_status_restarts_total{namespace="$namespace",pod_template_hash="",pod="$Pod",container="$container",container!=""}[1h])
You should expect a graph similar to this:
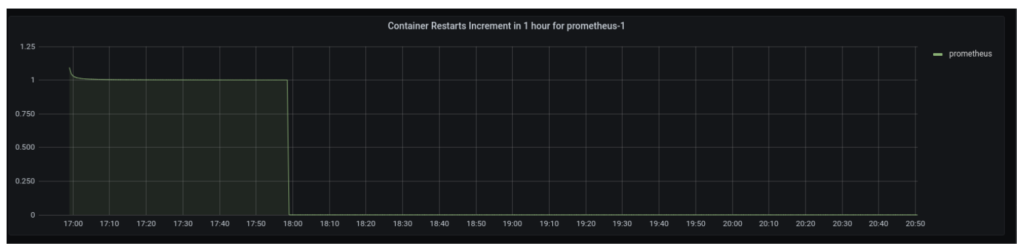
Looking at this graph, you can easily tell that the Prometheus container in a pod named prometheus-1 was restarted at some point, however there hasn’t been any increment in that after that.
There are 2 more functions which are often used with counters. They are irate() and resets(). The irate() function is used to calculate a per-second instant rate ideal for graphing volatile, fast-moving counters (while rate() is used for alerting and slow-moving counters). The resets()function is simply used to calculate breaks.
Prometheus Gauges
A gauge metric can both increment and decrement with time. When Prometheus scrapes a metric value, it’s basically looking at the current value of the gauge. Unlike counters, gauge metrics can be distorted using moving averages or resets.
Although some functions like rate() and increase() should be exclusively used with counters, most PromQL functions can be used with gauges. Series aggregations can be done using max, min and avg operators, which can also be performed over time by using functions likesum_over_time or min_over_time.
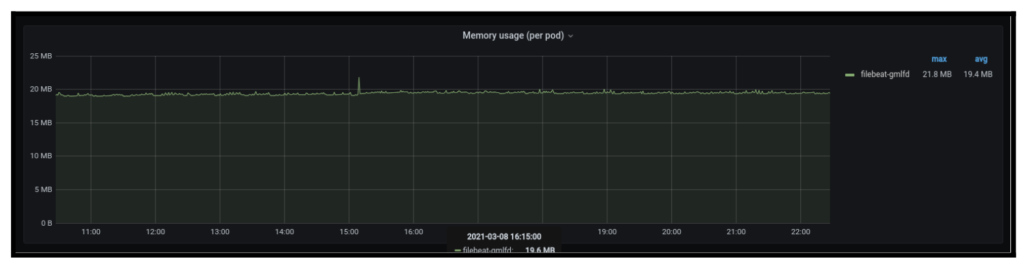
For illustration, let’s say you’d like to calculate the memory used by a container in a given pod named filebeat using a metric called container_memory_working_set_bytes . To do this, you would run the following: sum(container_memory_working_set_bytes{container="filebeat",pod=~"filebeat.*"}) by (pod)
Tips and Gotchas to Know About
- Operator Precedence: The following list shows the precedence of binary operators in Prometheus, from highest to lowest:
- ^
- *, /, %
- +, –
- ==, !=, <=, <, >=, >
- and, unless
- or
Operators on the same precedence level are left-associative. For example, 2 * 3 % 2 is equivalent to (2 * 3) % 2. However ^ is right associative, so 2 ^ 3 ^ 2 is equivalent to 2 ^ (3 ^ 2).
- Delta() function: The delta is extrapolated to cover the full time range as specified in the range vector selector, so that it is possible to get a non-integer result even if the sample values are all integers. In order to get around this, sometimes people use the
idelta()function. For illustration, imagine there is a metric which gets the rate of bytes ingested into your datastore (let’s call itingested_data_bytes). And there is also a curation job which drops older data. If you were to use adelta()function to represent data ingested over the last day, then it would re-adjust the metrics for when data gets cleaned up. Therefore,idelta()function is perfect for such a use case which would account for those changes.
idelta(ingested_data_bytes{}[1d])
- Absent() Function: This is a very helpful function in scenarios where there could be some metrics missing, especially when you trigger alerts based on those metrics. In the following example, the absent() function is used in conjunction with the original alert:
checker_upload_last_succeeded{instance="foo.bar"} != 1 or absent(checker_upload_last_succeeded{instance="foo.bar"}) == 1
However, it’s important to point out that this is mostly useful in cases where you do not use any aggregation functions, and only use a single metric, since it can quickly become unwieldy.
PromQL Query Optimization
Prometheus can be used in conjunction with Thanos for high availability and clustering. As a result, you can scrape off metrics from various Prometheus instances. This could lead to a large number of metrics and huge dataset. In such scenarios, it is important to add external labels to your metrics and then filter against them to optimize your promQL query. Adding external labels is easy, you just need to specify them in the global Prometheus config like this:global: scrape_interval: 5s evaluation_interval: 5s external_labels: cluster: $(CLUSTER_NAME) # Each Prometheus has to have unique labels. prometheus_replica: $(POD_NAME)
This adds a cluster and prometheus_replica label to each metric.
Another approach often used is an offset modifier, which allows changing the time offset for individual instant and range vectors in a query. Offsets are primarily used with range vectors and can be quite handy if you know what time range you’re looking for. Keep in mind that offset modifiers should be in the context of the function applied to a range vector, like this:sum(total_http_requests{method="POST"} offset 15m)
Lastly, it is always a good idea to record queries that take a long time to run using a recording rule. This creates a new time series based on the result of a complex query. Recording rules ideal for intensive, frequently used queries. For example, a dashboard popular with your team may depend on a complex query involving multiple metrics to render a particular graph. You can precompute the query to accelerate the rendering of the dashboard and also reduce workload on your server. See the Prometheus recording rules documentation for more information.
You like our article?
Follow our monthly hybrid cloud digest on LinkedIn to receive more free educational content like this.
Powered By Prometheus Cortex
Learn MoreNative support for PromQL across dozens of integrations
Automated event correlation powered by machine learning
Visual workflow builder for automated problem resolution
Get started with Prometheus faster than ever
Learn more about the challenges to scale Prometheus in a multi-cluster enterprise environment with high availability requirements, and how to overcome them.