Amazon Relational Database Service (Amazon RDS) is a web service that makes it easier to set up, operate, and scale a cloud-based relational database to thousands of database requests per second. It provides cost-efficient, resizable capacity for an industry-standard relational database and manages everyday database administration tasks in AWS.
Six different types of database engines are currently available in RDS:
- Amazon Aurora
- MySQL
- MariaDB
- Microsoft SQL Server
- Oracle
- PostgreSQL
As the heart of enterprise applications, we must monitor the condition of databases to identify health and performance issues and maintain their operational efficiency. However, traditional monitoring tools provide less visibility into RDS since it’s a managed service that doesn’t allow installing a monitoring agent on its host server. As such, we must take advantage of the native tools in AWS to monitor key performance indicators (KPIs) and events.
In this article, we will discuss various methods of monitoring RDS in AWS with native functionality such as:
- RDS reporting tools
- Native integrated monitoring tools
- Audit logging in RDS
RDS Monitoring Metrics
Before we discuss the above topics, you need to understand the essential metrics for database monitoring.
First, it is necessary to review your infrastructure and identify what DB resources are required. Requirements like CPU, memory, or disk space are measured by metrics. Since the requirements can change over time based on needs, we need to first understand current resource usage.
The metrics below are crucial to any database environment and any issues with them will typically be responsible for database performance issues:
- CPU
- Memory
- Database Connections
- Read/Write Latency
CPU
High CPU usage is an indicator of database performance issues. It may occur due to factors like buggy processes, slow/complex databases running queries, long persistent connections, etc. To fix CPU issues, you need to understand what is running on the database that is causing the high CPU usage and take action accordingly.
Examples of actions that may improve CPU load include killing long-running queries that may not be required, optimizing slow and complex SQL queries, removing persistent connections if they are not needed, identifying and killing CPU-intensive processes, and lowering the priority on processes where appropriate.
Also, make sure that your database is running with enough CPU for the workload it handles—consider upgrading the DB instance type class if the usage is more than 85% most of the time.
AWS provides three categories of DB instance types: Standard, Memory, and Burstable. Pick the right DB instance type based on the nature of your application.
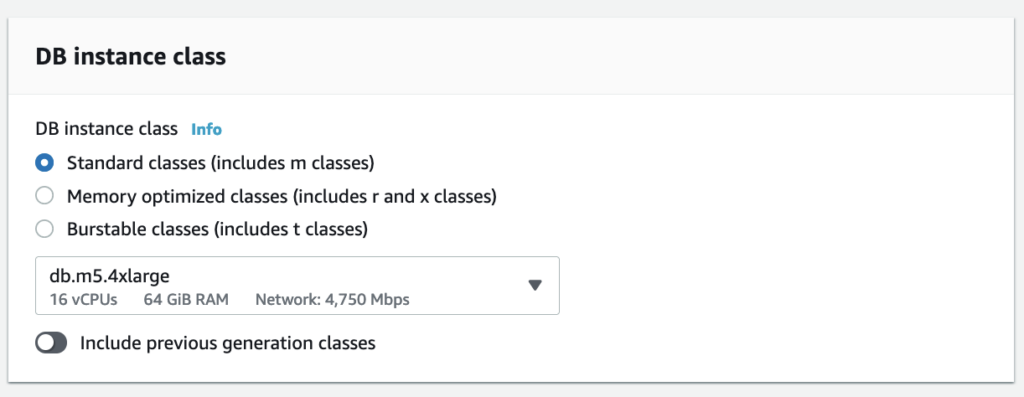
Note: If your application is CPU-intensive, the standard classes will be recommended.
Memory
Again here, it all starts with selecting the right DB instance types. If your application is memory-intensive, then memory-optimized classes are recommended.
The formula for calculating memory usage is as follows:
Memory usage = (Total memory - (Available memory + Buffer memory + Cache memory))/Total memoryIf your database contains large tables and you often use the SELECT query to load thousands of rows into memory, usage will quickly exceed your memory limits.
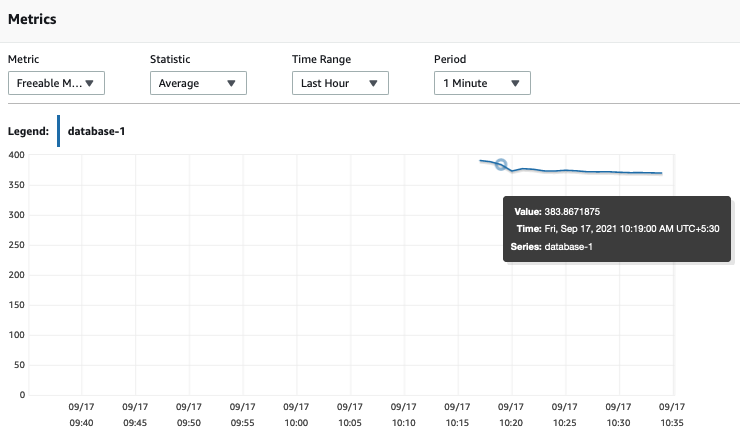
Cloudwatch, which is a monitoring and observability service from AWS, has the FreeableMemory metric, which can track unused memory on a database instance. When this metric gets low, it will result in significantly slower reads and make your database unable to respond to requests.
Note: You can change the CPU and memory available to a DB instance at any time by changing its DB instance class.
RDS Database Connections
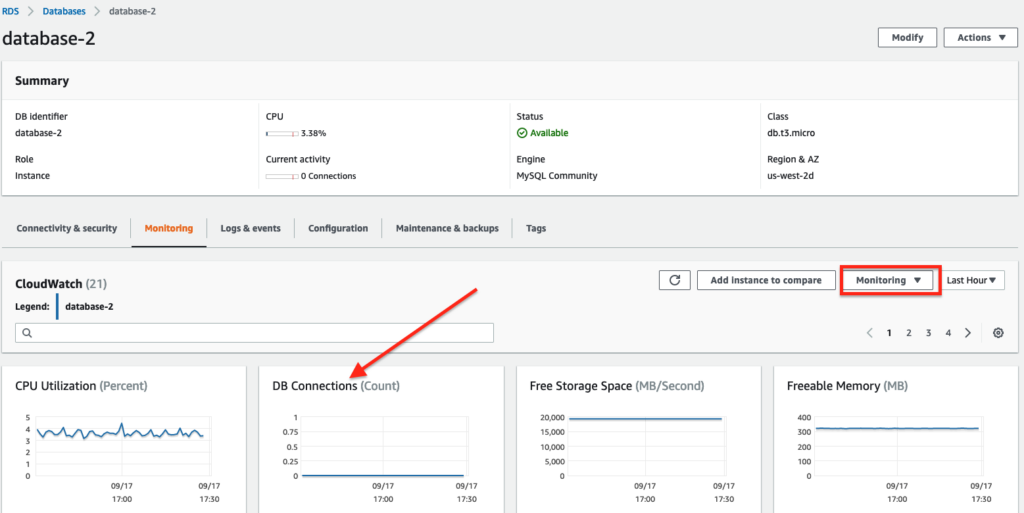
A DB instance can handle numerous connections based on its DB instance type, and you can use the connection metrics to track the current number of connections.
If the number of DB connections exceeds the maximum, it is possible that new connections will get rejected. It is always recommended to select the right DB instance types based on your application and set the maximum number of connections per DB instance.
In the RDS console, you can view the DB Connections metrics under the Cloudwatch Monitoring list.
Read/Write Latency
Read/write latency also depends on your DB instance type. Make sure to pick the right instance type for your application.
When your application goes beyond the compute or I/O capacity, configuring read replicas is an effective option to reduce the number of read operations on the master DB instance. Also, the read replicas will help with data redundancy across multiple regions in case of disaster.
RDS Monitoring Methods
RDS Reporting Tools
RDS provides several tools to help understand the resource usage of database instances.
Amazon RDS Instance Status
This basically gives us the overall status of the DB server. In the AWS RDS console, you can see two status columns: Status and Maintenance.
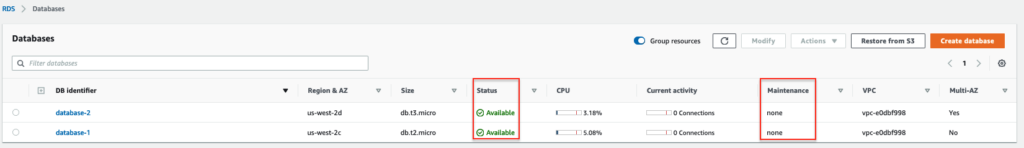
Status: The value here indicates the health status of a DB instance as shown below. Here the “Billed” column denotes whether AWS bills or charges for the DB instances in a particular status.
| DB Instance Status | Billed | Description |
|---|---|---|
| Available | Billed | The DB instance is healthy and functional. |
| Backing-up | Billed | The DB instance is currently being backed up. |
| Failed | Not billed | The DB instance has failed, and Amazon RDS can’t recover it. Perform a point-in-time restore to the latest restorable time of the DB instance to recover the data. |
| Maintenance | Billed | Amazon RDS is applying a maintenance update to the DB instance. This status is used for instance-level maintenance that RDS schedules well in advance. |
| Modifying | Billed | The DB instance is being modified because of a customer request to change it. |
| Restore-error | Billed | The DB instance encountered an error attempting to restore to a point in time or from a snapshot. |
Maintenance: This value indicates the status of any maintenance patches that need to be applied to a DB instance. Maintenance status is independent of DB instance status.
Amazon RDS Monitoring Recommendations
These are steps that AWS suggests to improve security, optimize cost, upgrade versions, etc. We can get the recommendations from the AWS side by following the below steps:
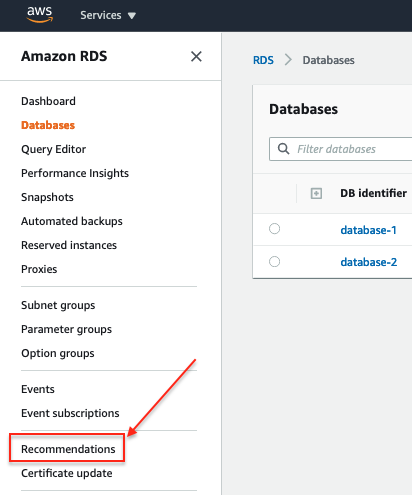
Once you click on the recommendation, you can see several categories:
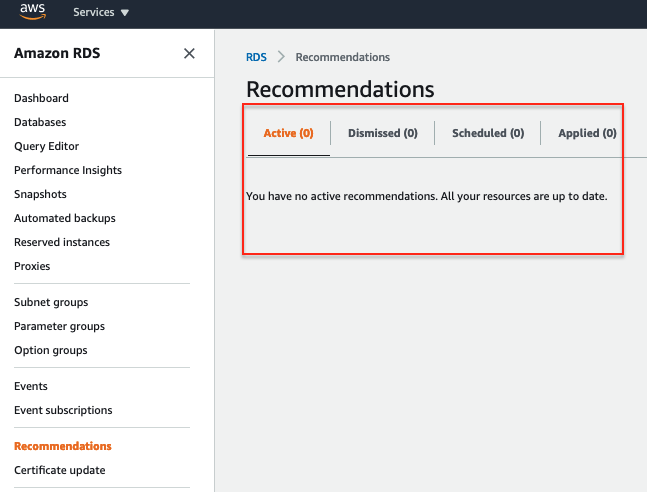
- Active: This shows the current recommendations that you can apply, dismiss, or schedule.
- Dismissed: This shows recommendations that were previously ignored.
- Scheduled: This shows recommendations that are scheduled but not yet applied. These recommendations will be applied in the next scheduled maintenance window.
- Applied: This shows the recommendations that are currently used.
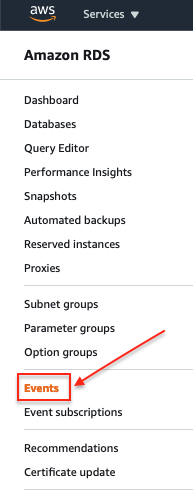
Amazon RDS Events
AWS provides all event details on database resources. Events are basically bare minimum logs of RDS activities, which sometime could be very crucial while doing a root cause analysis.
Example: The screenshot below shows that the “database-2” DB instance was created and then shows all the events that occurred:
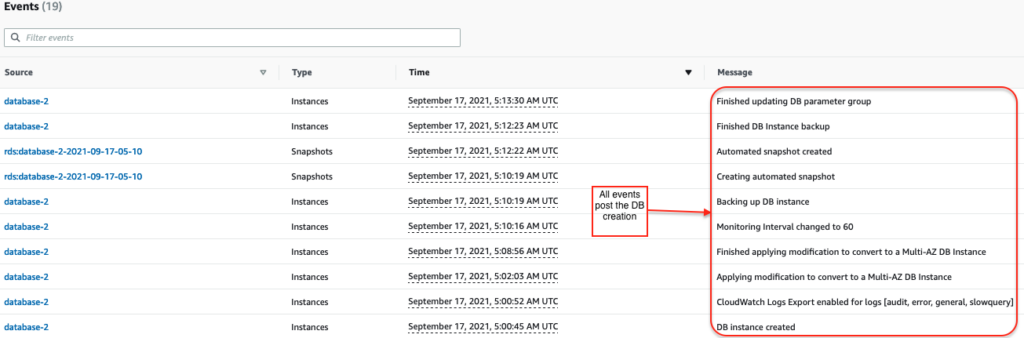
Note: In the AWS console, you can get a list of events for the last 24 hours, but in AWS CLI or RDS API, you can retrieve events from the previous 14 days. If you need to store events for extended periods, you can send Amazon RDS events to CloudWatch Events.
Amazon RDS Audit Logging
You can use the Audit Logging feature in RDS to improve security and trace postures by going through database audit information. This will let you answer these questions:
- Who accessed or modified the data?
- When was the data accessed or modified?
- How did a specific user gain access to the data?
- Was the change to the database table approved?
- Are privileged users abusing their superuser privileges?
To enable database auditing, Amazon RDS for MySQL supports the MariaDB audit plugin, and Amazon Aurora MySQL-Compatible Edition supports advanced auditing.
Usually, when you create a database instance, the default option group will be assigned to your DB instance; you cannot modify the option group once created.
How to Configure Audit Logging in RDS
Configure Audit Logging using the following five steps.
STEP 1: Create an Option Group
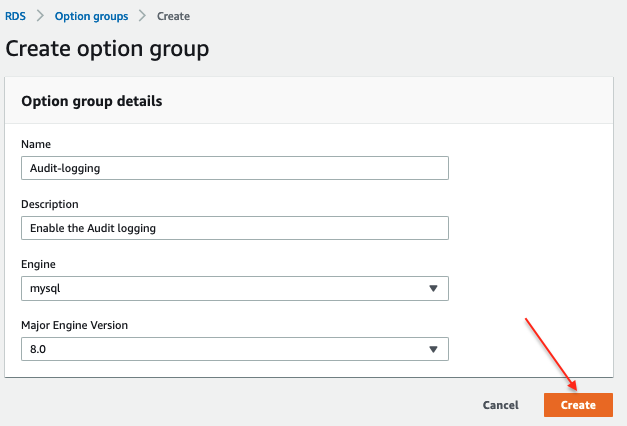
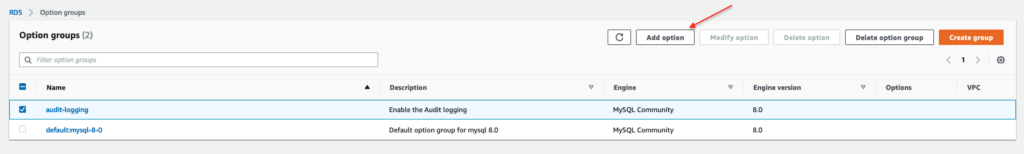
STEP 2: Add an Option in the Option Group
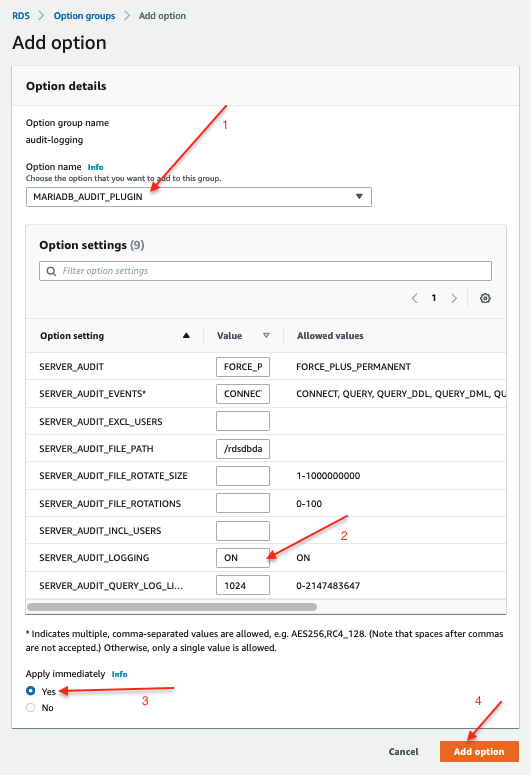
Here, the DB engine is Mysql. Once you have created the option group, click “Add option.”
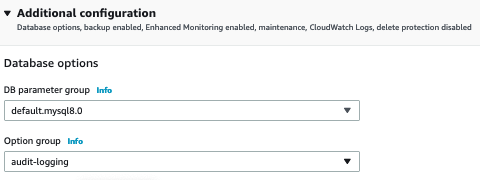
Configure the MariaDB Audit plugin settings as below:
Now you have an option group created where Audit Logging is enabled. Let’s assign this option group to the existing database instance.
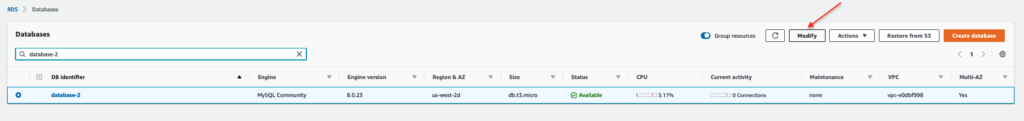
STEP 3: Change the Option Group
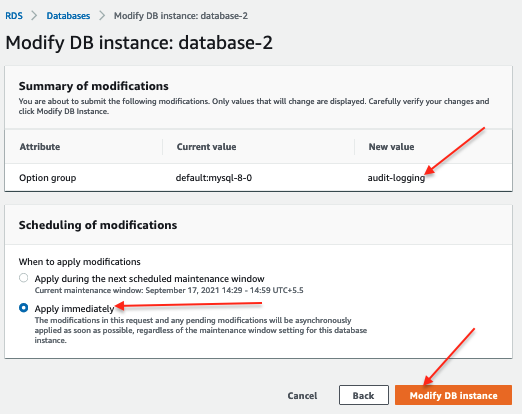
Select the existing RDS instance and click “Modify,” then change the option group and save the changes.
Select “audit-logging” from the drop-down that you created earlier.
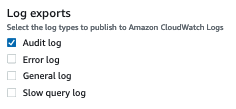
You can enable the audit log by checking the option below.
Select “Continue” and then click the “Modify DB Instance” option to reflect the changes.
STEP 4: Verify the configuration
Verify the audit logging configuration from the database instance:
mysql> show global variables like '%server_audit_logging%';
+----------------------+-------+
| Variable_name        | Value |
+----------------------+-------+
| server_audit_logging | ON    |
+----------------------+-------+
STEP 5: View the Audit logs
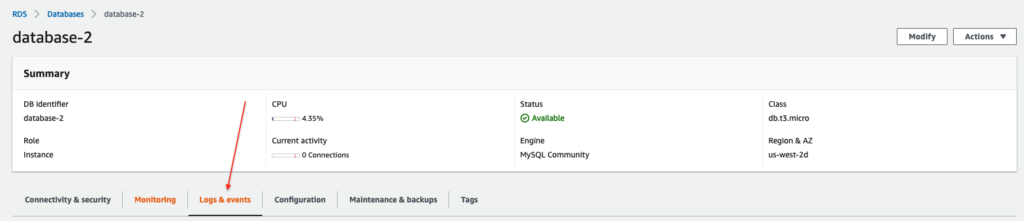
To view the audit logs, select your RDS instance, navigate to the “Configuration” tab, and select “Audit” as shown below.
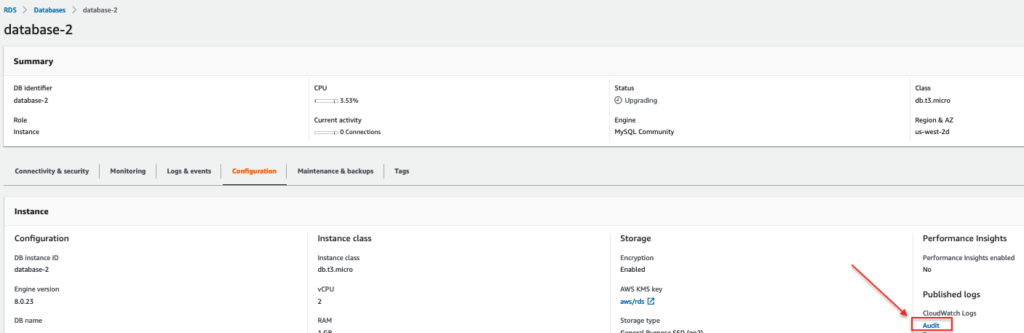
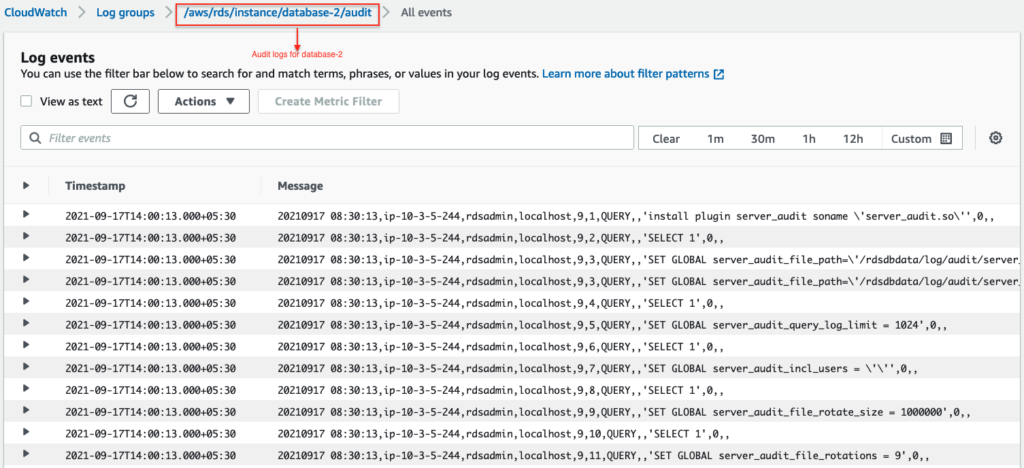
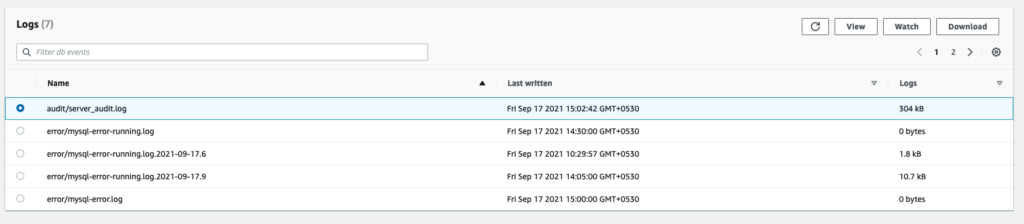
You can also view/download the audit log from the RDS console.
Amazon RDS Enhanced Monitoring
What is Enhanced Monitoring?
Usually, CloudWatch gathers metrics about CPU utilization from the hypervisor for a DB instance. Enhanced Monitoring runs an agent inside the DB instance that reports system metrics from a VM level, such as measurements related to the CPU, memory, the file system, and disk I/O, among others.
To use this feature, turn on the “Enhanced Monitoring” option for your RDS DB Instance and set a granularity. Enhanced Monitoring will collect vital operating system metrics and process information.
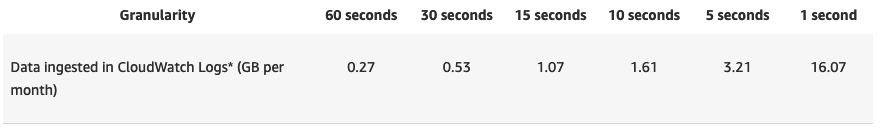
AWS pushes the metrics from RDS Enhanced Monitoring into your CloudWatch Logs account. You can create metrics filters in CloudWatch from CloudWatch Logs and display the graphs on the CloudWatch dashboard.
The approximate volume of data ingested into CloudWatch Logs by Enhanced Monitoring is as shown below:
How to Enable Enhanced Monitoring
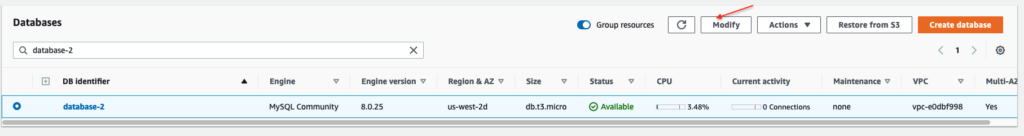
In the RDS console, select the DB instance for which you want to enable Enhanced Monitoring and click “Modify.”
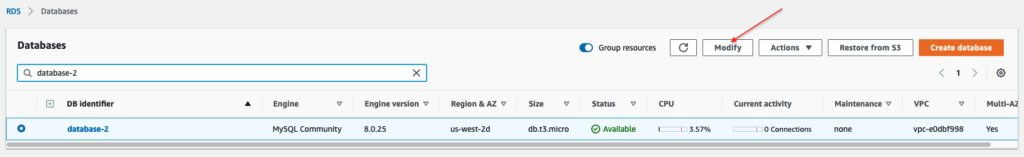
You need to select the “Enhanced Monitoring” option on the modify page, as shown below, and update the changes:
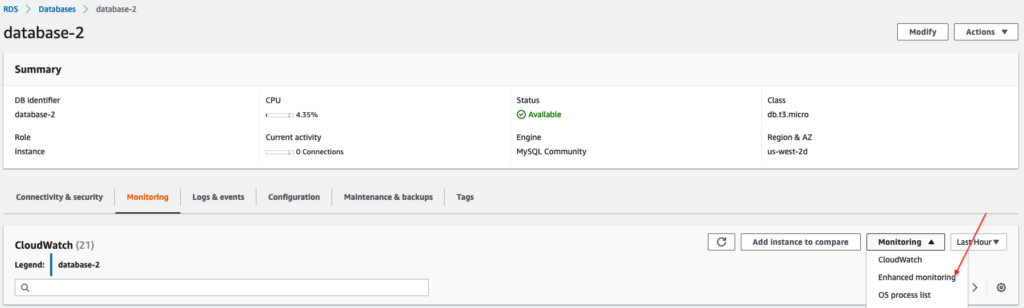
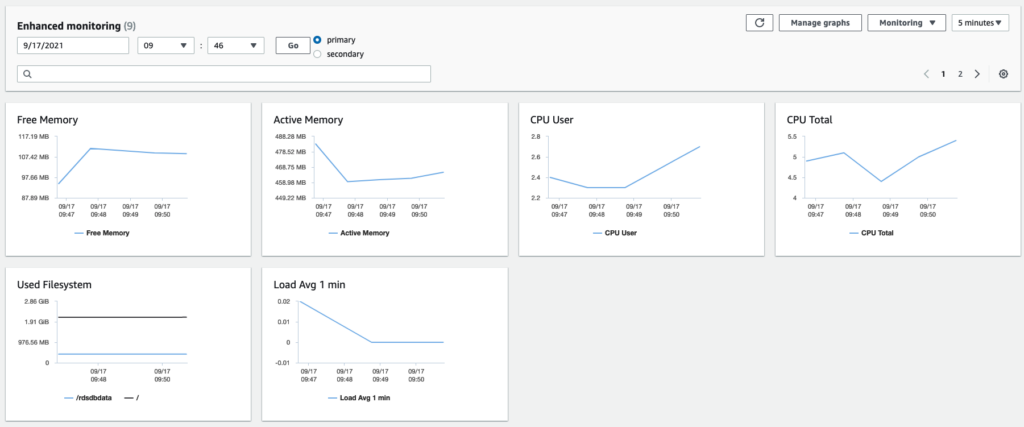
Once you have selected Enhanced Monitoring, it will show all system metrics for that DB instance:
Amazon RDS Performance Insights
What are Performance Insights?
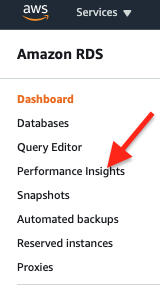
In the RDS console, you can see an option for Performance Insights, which we can use to find the load on the database and determine when and where to take action. In the RDS Console, select Performance Insights:
The performance metrics dashboard has two sections. In the upper section, you can see resource usage for your instance, like CPU, I/O, etc. The below image shows SQL queries and their resource consumption data.
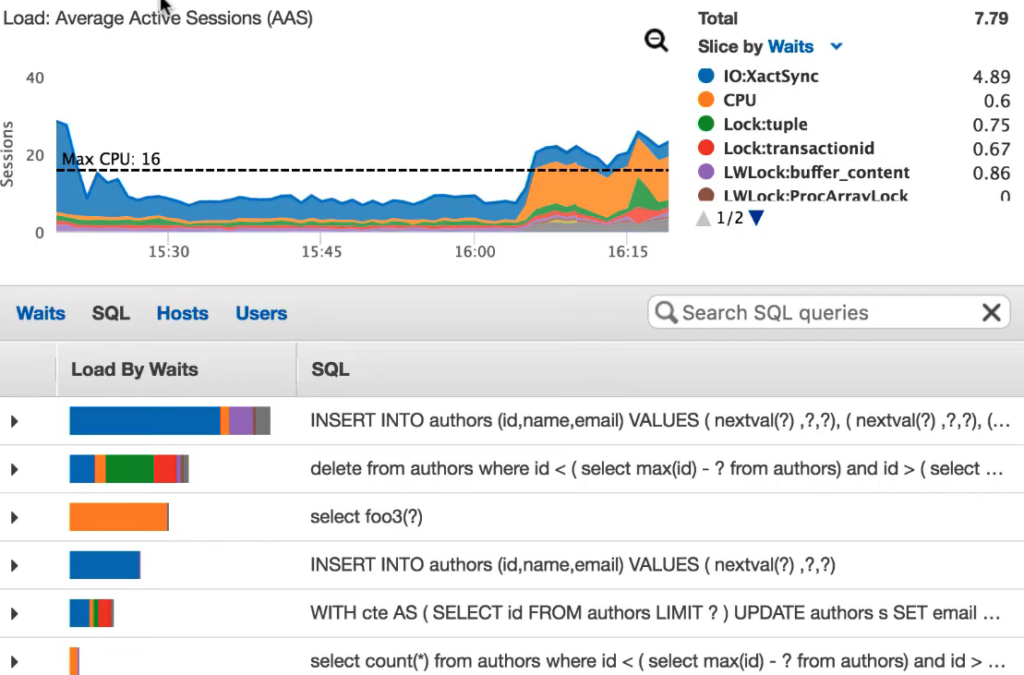
Here the CPU usage is high, as shown in orange in the graph. The image also shows the SQL query (select foo) responsible for the high usage.
The Performance Metrics dashboard is easy to use and requires no additional configuration to set up. You just need to navigate the Performance Insights dashboard and select the DB instance to view its usage information.
With seven days of free performance history retention, it’s easy to track down and solve a wide variety of issues. If you need longer-term retention, you can choose to pay for up to two years of performance history retention.
Performance Insights is currently available for Amazon Aurora PostgreSQL-Compatible Edition, MySQL-Compatible Edition, PostgreSQL, MySQL, Oracle, SQL Server, and MariaDB.
AWS Native Integrated Monitoring Tools
Amazon CloudWatch
As mentioned above, we can get several important metrics from CloudWatch.
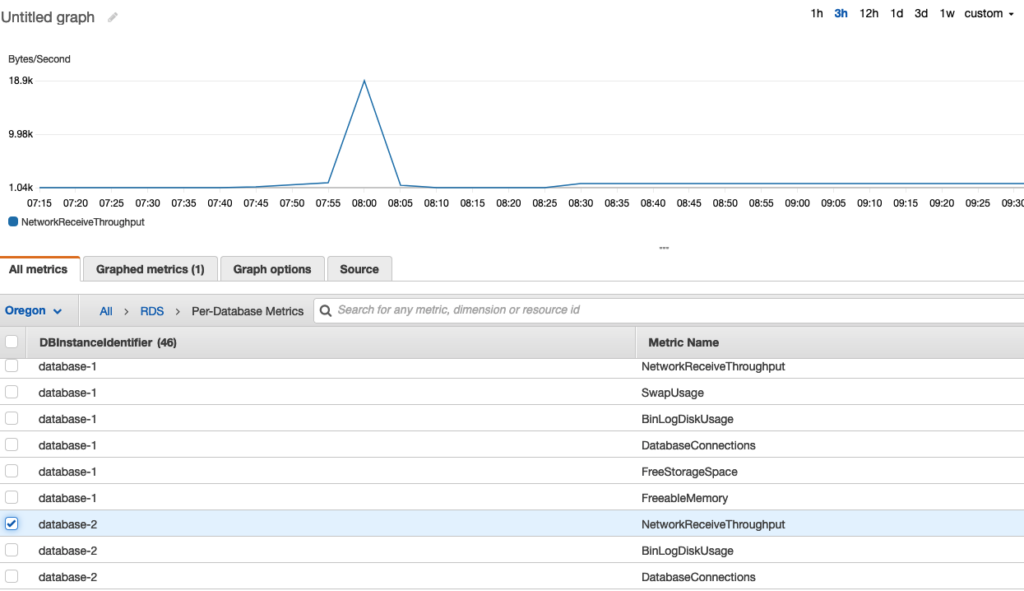
In the Cloudwatch console, select “All metrics” and then “RDS” to view all RDS metrics, as shown below.
Choose a metric dimension, for example, By Database Class.
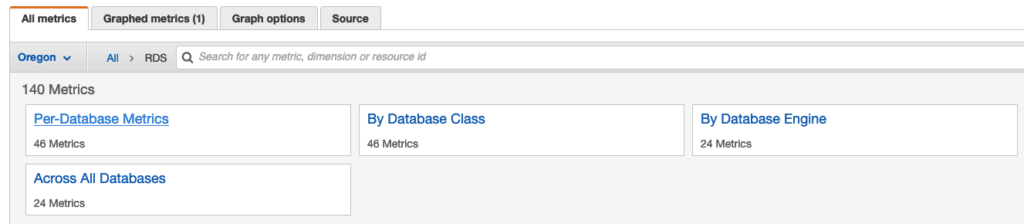
To sort the metrics, use the column heading. To graph a metric, select the check box next to the metric. To filter by resource, choose the resource ID and then select Add to search. To filter by metric, select the metric name and then select Add to search.
Amazon CloudWatch Logs
You can configure your DB instance to publish log data to a log group in Amazon CloudWatch Logs. There are four types of logs that you can send from your RDS instance to Cloudwatch:
- Audit log
- General log
- Slow query log
- Log output
To enable these logs, you need to modify your DB instance:
Then navigate to the Log exports section and check the boxes:
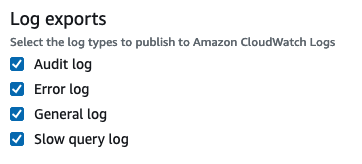
Audit Log: The DB instance must use a custom option group with the MARIADB_AUDIT_PLUGIN option.
Error Log: The DB instance must use a custom parameter group with the parameter setting general_log = 1 to enable the general log.
General Log: The DB instance must use a custom parameter group to enable the slow query log with the parameter setting slow_query_log = 1.
Slow Query Log: The DB instance must use a custom parameter group with the parameter setting log_output = FILE to write logs to the file system and publish them to CloudWatch Logs.
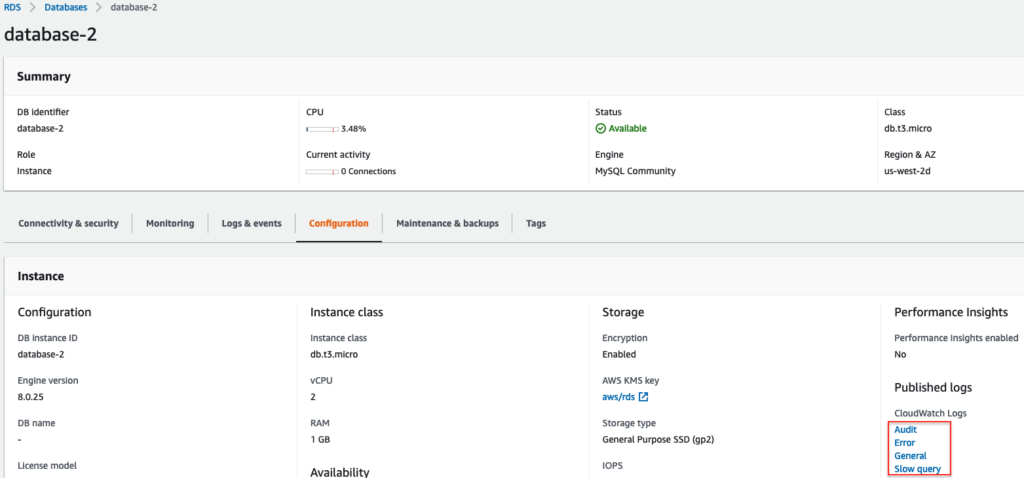
Once you select the above-mentioned checkboxes under “Log exports,” click “Continue” -> “Modify DB Instance” to reflect the changes. Then, to verify the logs, select your DB instance and navigate to the “Configuration” tab:
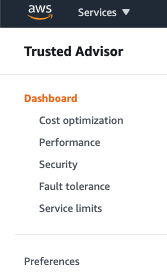
Trusted Advisor Dashboard
If you have an AWS Enterprise level account, you can use the Trusted Advisor, which provides recommendations. These recommendations are beneficial for handling cost optimization, security postures, etc. The Trusted Advisor provides recommendation data in the categories below:
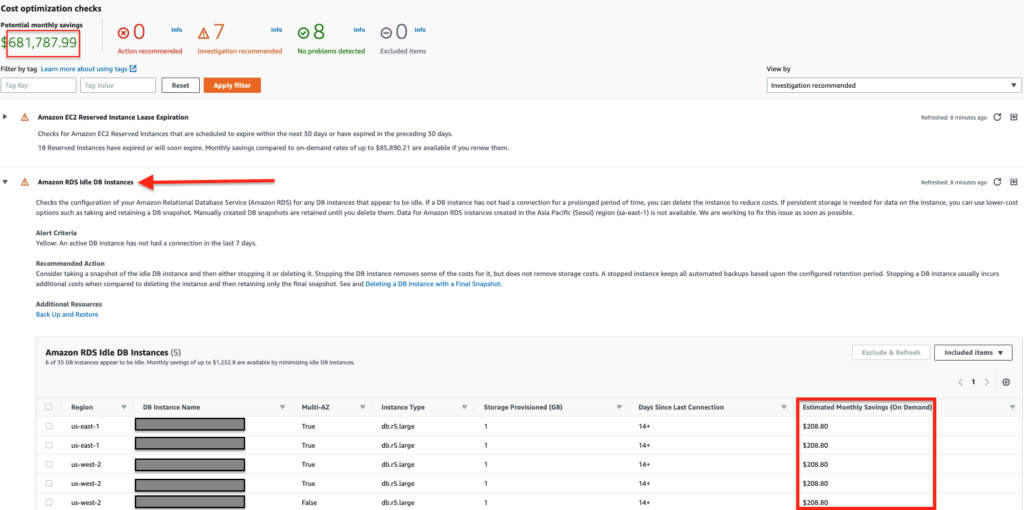
The following is an example of a recommendation for RDS Idle instances. Here you can see a forecast of which DB instances are idle and how much they are costing on a monthly basis. You also get an overall forecast of monthly savings.
Holistic Monitoring
A comprehensive monitoring platform must not only cover your database system but also extend to all of your applications including those hosted on other public clouds or private data centers.
The events generated from a native AWS RDS monitoring tool can be forwarded to a centralized and intelligent event management system so that they can be cross-correlated with events generated from other monitoring tools using analytics based on machine learning algorithms.
Another important ingredient to a successful monitoring strategy is the use of automation. With automation, remedial workflows can be implemented and triggered by accurate alerts to shorten time to resolution and relieve the operations team from repetitive tasks.
The OpsRamp platform is designed to consolidate tooling and enable integration by offering an open platform that delivers hybrid infrastructure discovery and monitoring, event and incident management, and remediation and automation.
Conclusion
One important issue that we discussed numerous times in this article was picking the right DB instance type to suit your application. Once you have chosen the appropriate RDS types and size, monitoring can help identify performance bottlenecks, providing an active alerting system and historical data for root cause analysis.
We recommend using AWS tools like Cloudwatch, RDS recommendations, audit logs, Enhanced Monitoring, Trusted Advisor, and Performance Insights to help you understand your DB usage patterns, identify issues, and fix them.
When you are ready to integrate the monitoring of your AWS services with the rest of your hybrid cloud environment, request OpsRamp for free demo and let it bring machine learning and automation alongside dozens of integrations to streamline your end-to-end operations.
You like our article?
Follow our monthly hybrid cloud digest on LinkedIn to receive more free educational content like this.