Scale your Prometheus monitoring efficiently and effectively.
Introduction
An Administrator’s Guide to Prometheus Monitoring

Chapter 1
How to Query With PromQL
Introduction
Prometheus is a free and open-source monitoring tool popular with Kubernetes administrators due to its simple installation and native integration. Sponsored by SoundCloud, Prometheus became an incubating project of the Cloud Native Computing Foundation (CNCF) in 2016, graduating in 2018. Since then, the open-source community has come together to overcome its lack of high availability with Thanos and help it scale with Cortex.
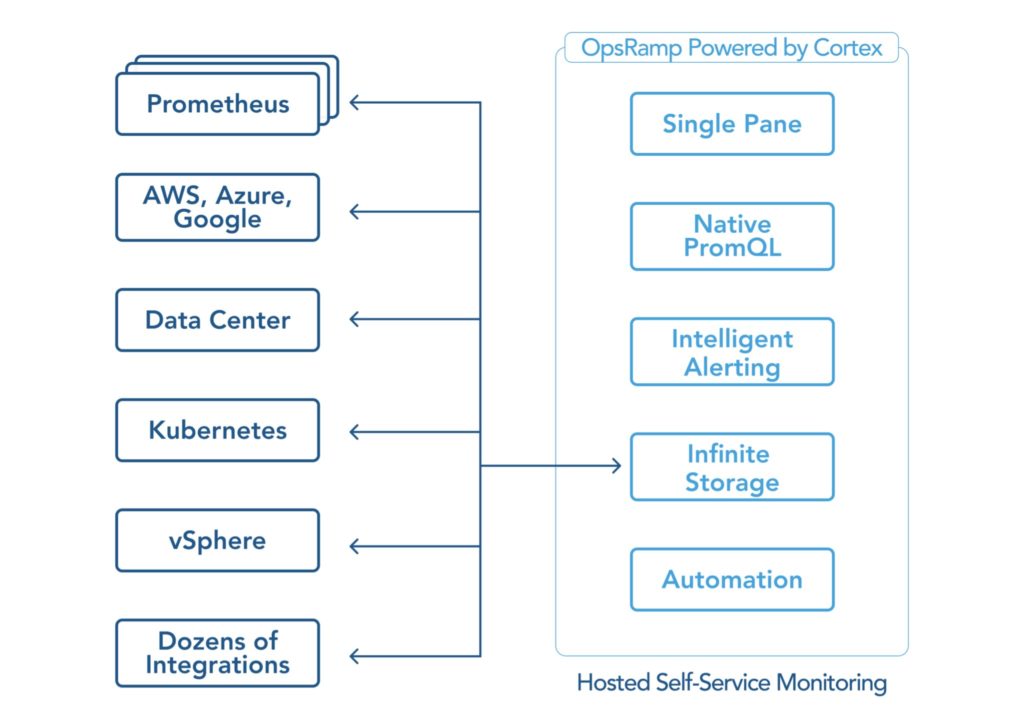
It is easy to install Prometheus in a single Kubernetes cluster, but it is challenging to scale Prometheus in a multi-cluster enterprise environment with high availability requirements. As a committed member of the Prometheus community, OpsRamp has adopted Prometheus Cortex in the core of its platform to offer native compatibility.
OpsRamp helps Prometheus administrators with the enterprise scaling challenge by:
- Importing and storing Prometheus metrics data to avoid the burden of managing dozens of local databases across Kubernetes clusters
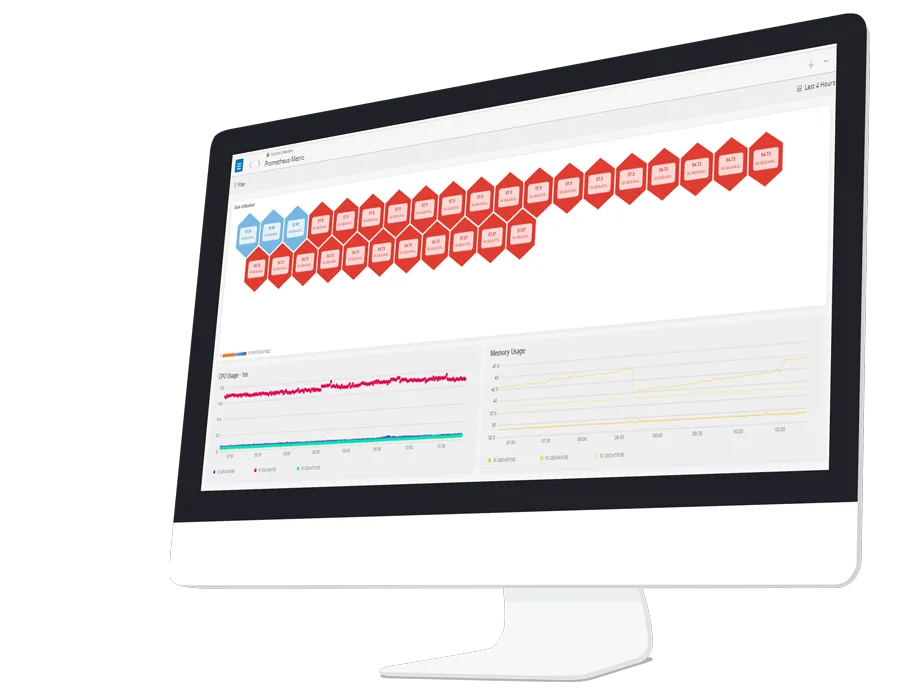
- Providing a modern and hosted visualization layer that natively supports PromQL for Prometheus and other integrations directly supported by OpsRamp
- Leveraging state-of-the-art machine learning algorithms to ingest Prometheus alerts, cross-correlate with alerts from other supported OpsRamp integrations, and improve alerting accuracy
- Bringing all of its platform’s features such as integrations with public clouds and runbook automation to offer a single pane of glass
As a sign of commitment to Prometheus technologies, we have created this guide to help the Prometheus user community better appreciate the Prometheus architecture, configuration, scaling, and query language.
Chapter 1: PromQL
Learn how to query Prometheus using PromQL, using examples and reference tables.
Chapter 2: Prometheus Alerting
Become familiar with Prometheus alerting, end-point configuration, and notifications.
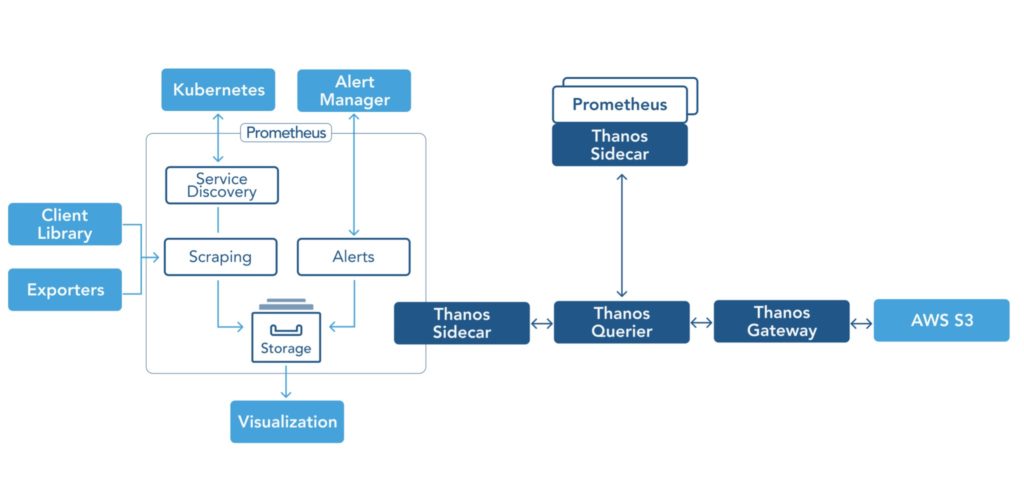
Chapter 3: Prometheus Thanos
Find out how you can scale Prometheus and make it highly available using Thanos.
Chapter 4: Prometheus Operator
Learn Prometheus Operator Custom Resource Definitions (CRD) and common pitfalls.
Chapter 5: Prometheus Node Exporter
Explore the features of the Node Exporter and learn how to configure it.
Chapter 6: Prometheus vs Grafana
Understand the differences between Prometheus and Grafana and learn about an alternative.
Chapter 7: Prometheus Cortex
Find out why and how Prometheus administrators use Cortex to scale.
Chapter 8: Prometheus Blackbox Exporter
Understand the differences between Prometheus and Grafana and learn about an alternative.
Get started with Prometheus faster than ever
Learn more about the challenges to scale Prometheus in a multi-cluster enterprise environment with high availability requirements, and how to overcome them.