Capture and aggregate critical availability and performance metrics for open source and commercial applications to deliver rapid root cause analysis for performance issues.
Hybrid Observability
Capture and aggregate critical availability and performance metrics for open source and commercial applications to deliver rapid root cause analysis for performance issues.

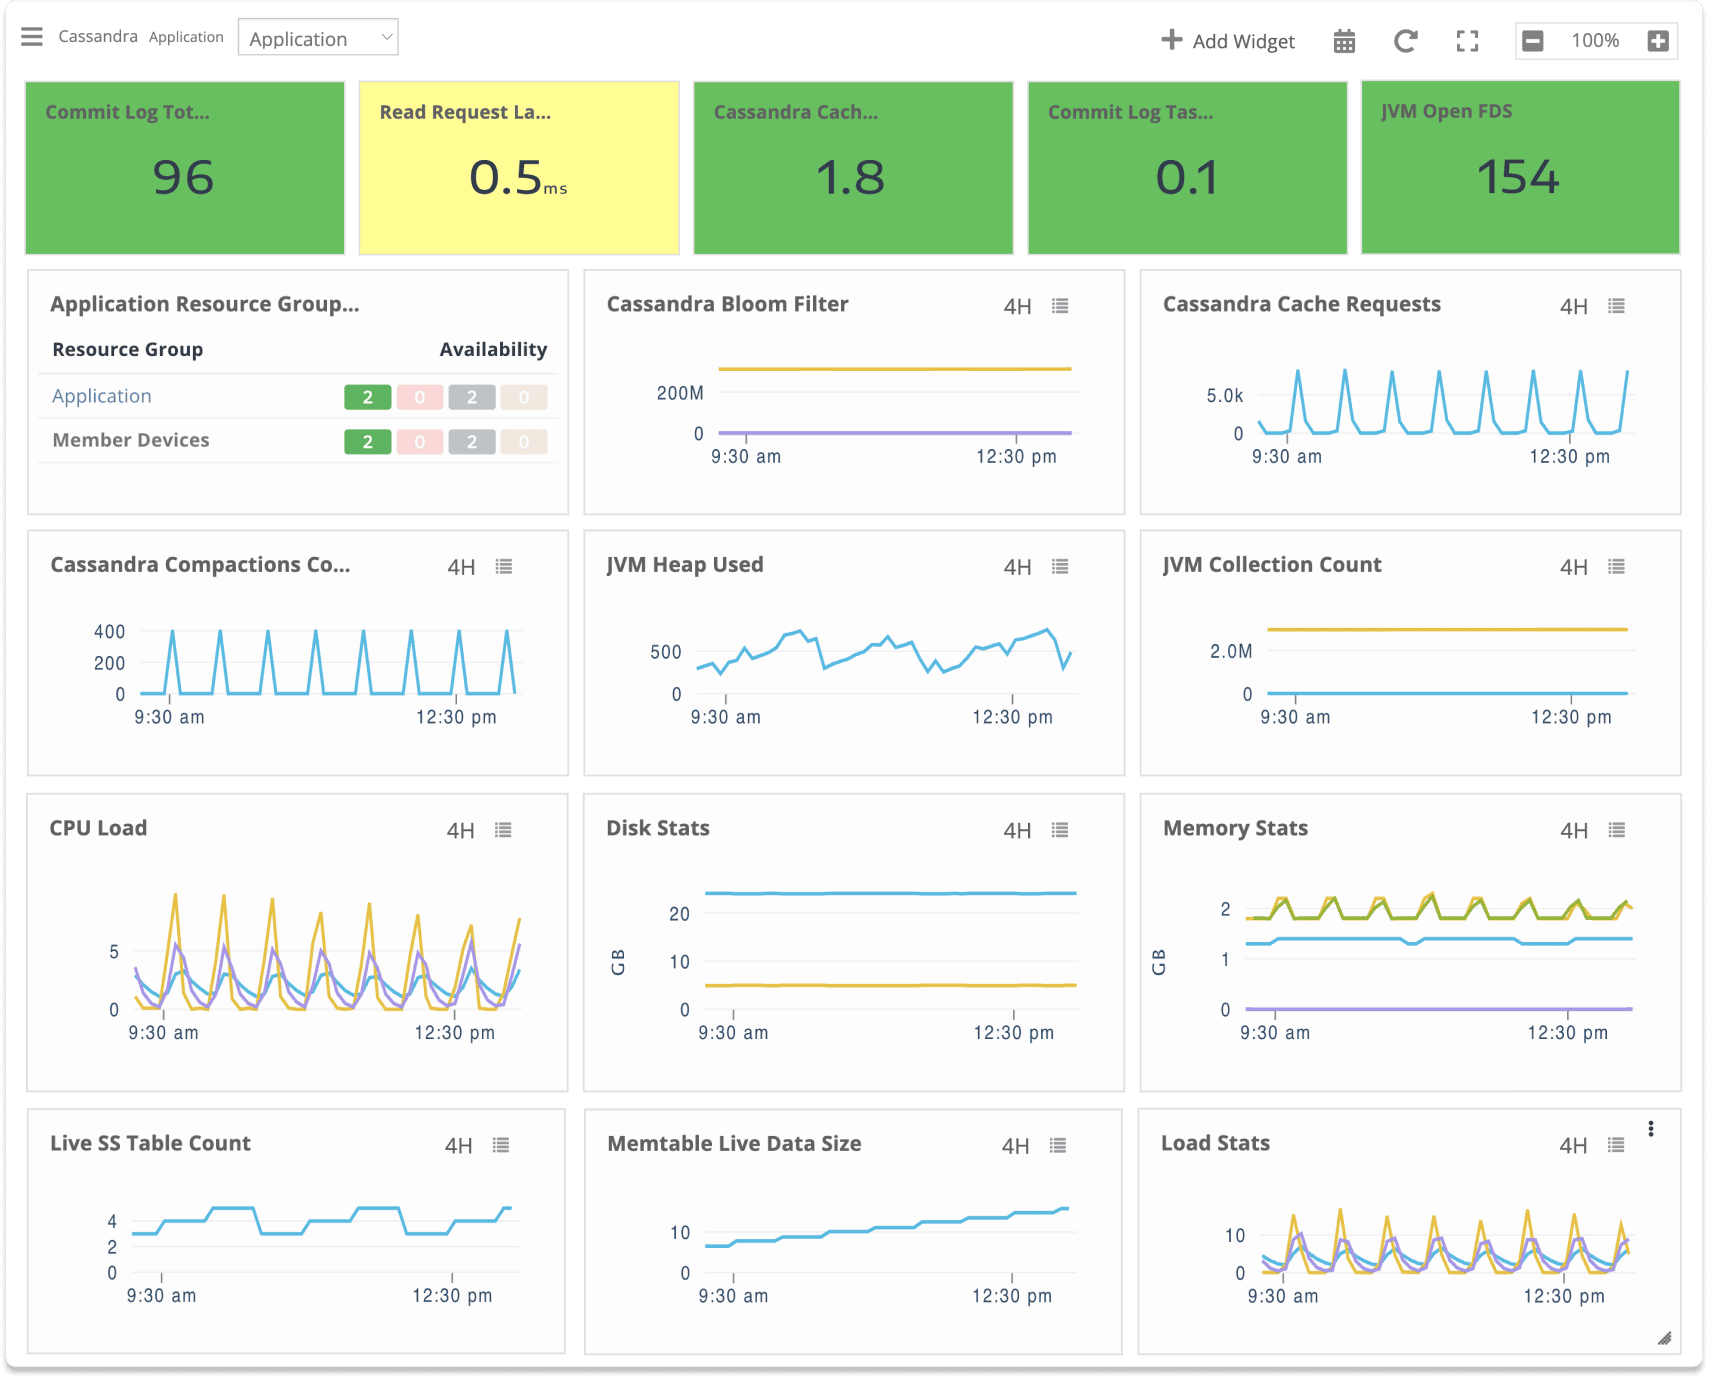
OpsRamp’s application monitoring capabilities include both agent-based and agentless approaches. Agent-based monitoring offers granular metrics for application health visibility and dependency mapping for real-time impact analysis. Agentless monitoring enables the quick collection of application performance metrics without any management overhead. The OpsRamp AIOps engine correlates alerts and metrics to aid in prioritization and troubleshooting.
The platform approach to ITOM including the rise of new organizational models in monitoring, management, and analytics. Artificial intelligence adoption in the modern enterprise, dispelling some common myths and fallacies.
• Proactively detect issues, restore services and minimize outages of business critical applications.
• Understand dependencies between business applications and the underlying IT infrastructure that supports them.
• Reduce latency of application services to improve application response times and transaction processing times.
• Improve throughput of applications so that more users can be served and more processes executed without affecting application performance.