Prometheus is a free and popular monitoring tool in DevOps toolkits. Metrics from both applications and infrastructure can be scraped using Prometheus for long-term retention, alerting, and display. Prometheus is a stateful application with a centralized proprietary database and does not natively offer a high availability architecture.
This article will explain how you can achieve high availability and a global view for Prometheus using an open-source companion project named Thanos.
What About Prometheus Federation?
First, let’s review the Prometheus federation functionality as an alternative to Thanos and understand its limitations.
Prometheus natively supports Prometheus federation, which gives a global view of metrics across various Prometheus instances. However, Prometheus federation still doesn’t solve the challenge of high availability.
Prometheus federation enables a central Prometheus instance to collect metrics from different Prometheus instances located in various Kubernetes clusters. Some of these instances could be co-located in the same Kubernetes cluster; however, the co-located instances should not have the same metrics endpoints as targets since Prometheus cannot natively de-duplicate data. This lack of functionality goes to the heart of the Prometheus federation’s limitation. It means that each Prometheus instance can target only a complementary subset of the metrics to avoid duplication. This constraint implies that metrics can not be collected redundantly, and data will be lost when a Prometheus instance becomes unavailable.
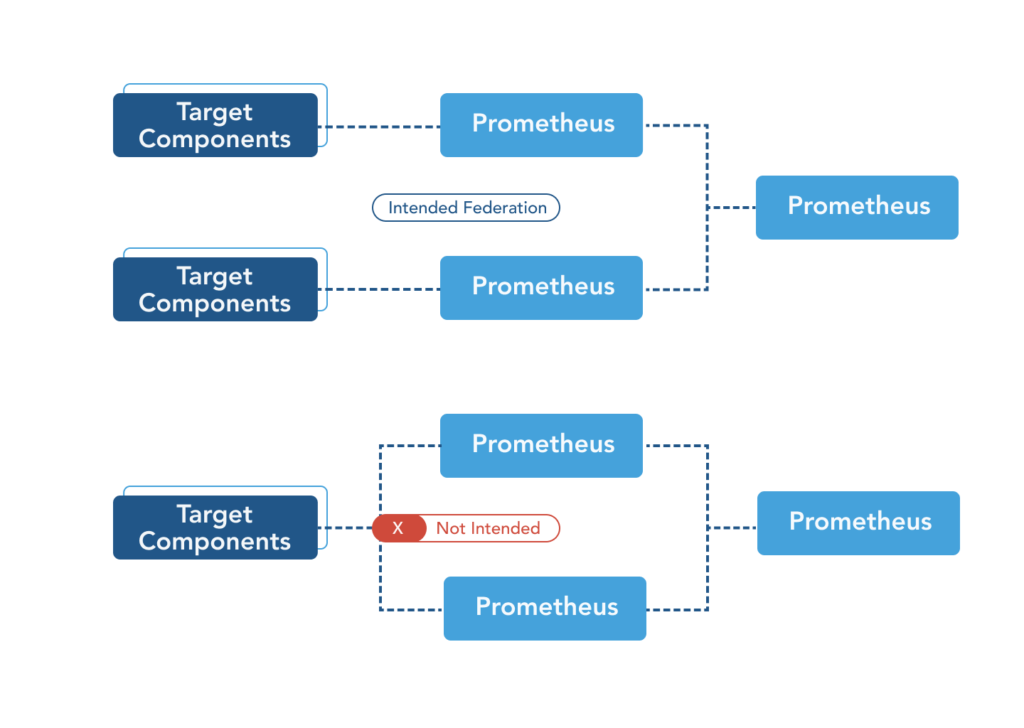
Prometheus federation exacerbates this problem by conserving computing power and storage space (relied on to function in large environments) by scaping only a subset of the granular metric data collected and time-stamped by various Prometheus instances.
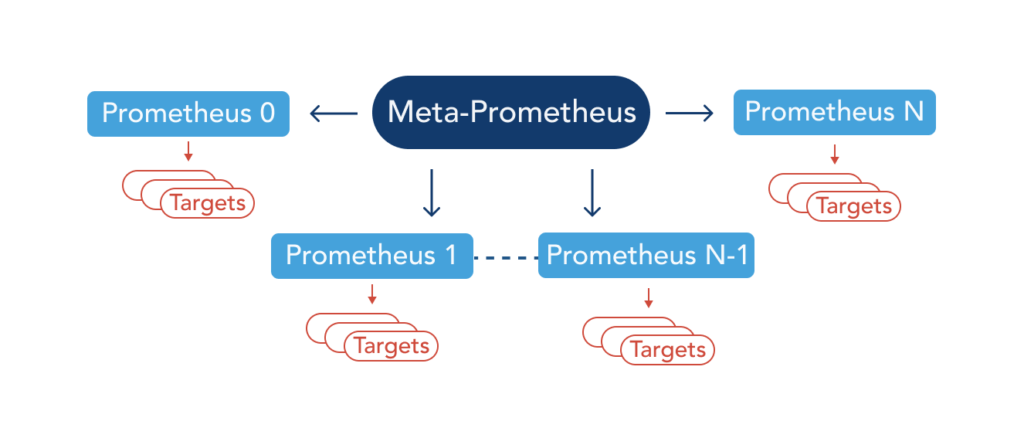
Therefore a highly available Prometheus environment must rely on multiple Prometheus instances scraping data and feeding a global system to query, de-duplicate, and display data from all other Prometheus instances. This exact functionality is the design inspiration behind Thanos.
Introducing Thanos
Using Thanos, you can orchestrate a multi-cluster Prometheus environment to horizontally scale and be highly resilient. A multi-cluster Prometheus environment is created when an instance of Prometheus is installed (as required) in each of the many Kubernetes clusters under operational management. In that scenario, Thanos also provides long-term metric retention, archiving capabilities, and is extendable across multiple Kubernetes clusters to achieve a proper multi-cluster monitoring setup.
Benefits of Thanos include:
- A centralized, global query view
- Prometheus high availability
- Long term metrics retention
- Easy backup for metrics
- Ability to scale cross-cluster
- Cheap data access
What is Thanos?
Thanos is a group of microservices that run alongside your Prometheus deployment. One of those services (thanos-sidecar) runs as a container in the same pod as Prometheus.
Thanos Architecture: 7 Important Components to Know
Let’s take a more detailed view of all the Thanos components in the following diagram. You can reference component definitions using the table found in this section.
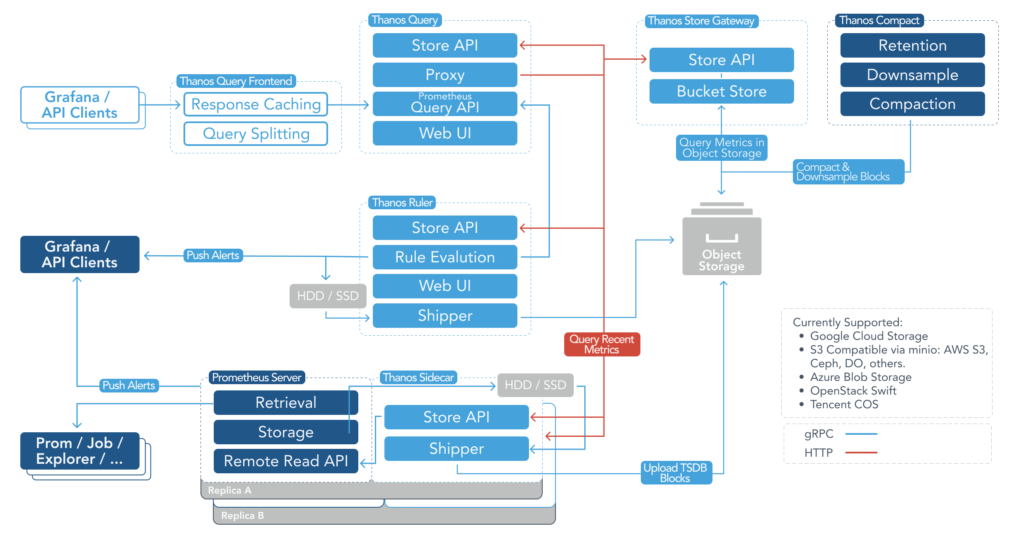
| Component | Definition |
|---|---|
| Sidecar | Connects to Prometheus, reads its data for queries, and uploads data in time chunks to cloud storage solutions like AWS or GCS |
| Store Gateway | Serves metrics from a storage bucket like S3 |
| Compactor | Compacts, downsamples, and applies retention to the metric data stored in a cloud storage bucket |
| Receiver | Receives data from Prometheus’s remote-write WAL, exposes it and/or uploads it to cloud storage |
| Querier | Implements Prometheus’s v1 API to aggregate data from the underlying components |
| Query Frontend | Implements Prometheus’s v1 API and proxies it to query while caching the response and optionally splits queries by day |
| Ruler | Evaluates recording and alerting rules against data in Thanos for exposition and/or upload |
Solving The Prometheus High Availability Challenge
Prometheus uses a proprietary Time Series Database (TSDB) that does not natively offer any data replication or high availability. The Prometheus documentation recommends the use of disk RAID and frequent backups to protect minimally against an outage. Each instance of Prometheus is a stateful application with a centralized database. You may add more data collection capacity by launching additional Prometheus replicas; however, an outage would still result in loss of data. Achieving actual high availability with Prometheus is challenging and a core reason for the creation of Thanos.
The diagram below shows how Thanos achieves high availability in a Prometheus environment. Two instances of Prometheus within the same Kubernetes cluster (ideally deployed in two zones or regions) collect monitoring data. Thanos Querier pulls the data from replicas, deduplicates the data, and responds to the Querier consumer. Thanos then stores its data in an S3 bucket. The S3 service may also replicate its content across regions for additional redundancy.
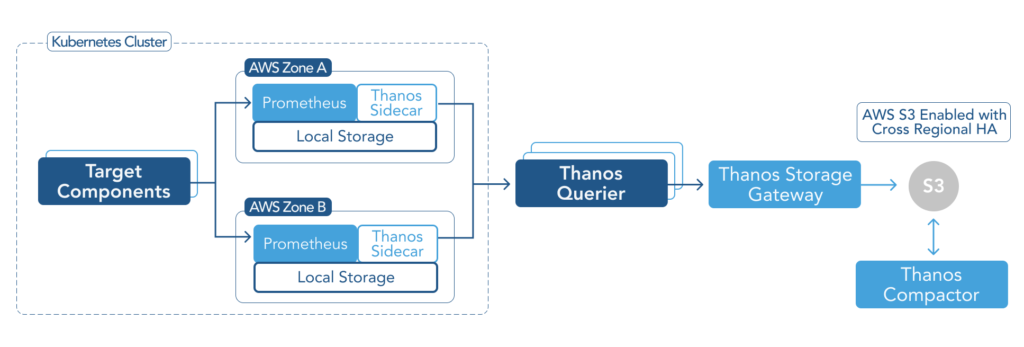
The Thanos visualization layer does not directly access each instance of Prometheus to present data in the user interface but instead relies on Thanos Querier to serve de-duplicate and redundant data. Suppose one Prometheus instance goes down due to VM failure or zonal outage. In that case, another Prometheus replica will continue to collect metric data and store it in the S3 bucket to support data visualization and historical storage.
While one Prometheus instance is down, Thanos will continue to collect metrics from the redundant Prometheus instance and store the metrics in the S3 bucket. It will seamlessly respond to the queries to fetch and display metrics while one Prometheus instance is out of service. Once the failing node is online again then it will resume to collect metrics from both instances and de-duplicate the metric data stored in the S3 bucket. This resilient functionality becomes especially valuable during regular maintenance or upgrades.
You may have noticed in our earlier Prometheus configuration example that we added two external labels to each metrics:
- prometheus_replica: This label corresponds to the pod name for each Prometheus
- cluster: This label is set by the user
A PromQL query on any of the two Prometheus replicas would show both of those labels. However, when you run those same queries on the Query frontend, you will only see the cluster label. This is because we are deduplicating data against the prometheus_replica label by passing the --query.replica-label=prometheus_replica flag to Thanos Query.
See how OpsRamp enhances Prometheus in minutes with Prometheus Cortex
How to Get Started with Thanos
We can get up and running with a clustered Prometheus set up relatively quickly. Here are the prerequisites for it leveraging Google Kubernetes Engine even though you could use AWS or Azure-hosted Kubernetes services as well:
- A Kubernetes cluster (in this example, GKE) with at least three nodes.
- Two GCS buckets for metrics retention.
1. Create Storage Buckets and Define Credentials
- Create two GCS buckets, named
prometheus-long-termandthanos ruler. - Download the credentials for a service account that has write access to your newly created buckets.
- Save the credentials in a file named
thanos-gcs-credentials.json.
2. Deploy Prometheus-Thanos
We have put together this Helm chart for you to deploy Prometheus-Thanos quickly.
- Clone the Helm chart repo.
- Update the ingress endpoints reflecting your organization’s domain:
sed -i -e s/<your-domain>/yourdomain/g k8s/monitoring/prometheus-ha/values.yaml- Create a Kubernetes secret from the Thanos-GCS-credentials file:
kubectl create secret generic thanos-gcs-credentials --from-file=thanos-gcs-credentials.json -n monitoring- Update your alertmanager’s configuration, which can be found at
configs/alertmanager-config.yamlwith the appropriate alert delivery endpoints. - Make sure you set the Prometheus cluster name in the
values.yaml.

3. Install a helm chart
- Run the following:
helm upgrade --install <RELEASE_NAME> prometheus-ha/- Review all the workloads that were created:
kubectl -n monitoring get deploy$ kubectl -n monitoring get deploy
NAME DESIRED CURRENT UP-TO-DATE AVAILABLE AGE
alertmanager 1 1 1 1 10m
kube-state-metrics 1 1 1 1 10m
thanos-querier 1 1 1 1 10m
$ kubectl -n monitoring get statefulsets
NAME DESIRED CURRENT AGE
grafana 1 1 10m
prometheus 3 3 10m
thanos-compactor 1 1 10m
$ kubectl -n monitoring get pods
NAME READY STATUS RESTARTS AGE
alertmanager-7b77799974-2lxkz 1/1 Running 0 10m
grafana-0 1/1 Running 0 10m
kube-state-metrics-6c7f456ddc-7cq8w 2/2 Running 0 10m
node-exporter-4lrxj 1/1 Running 0 10m
node-exporter-575rp 1/1 Running 0 10m
node-exporter-vvwkd 1/1 Running 0 10m
prometheus-0 2/2 Running 0 10m
prometheus-1 2/2 Running 0 10m
prometheus-2 2/2 Running 0 10m
thanos-compactor-0 1/1 Running 0 10m
thanos-querier-7dd85d6cb5-8d5s6 1/1 Running 0 10m4. Explore Thanos Store Gateway
The previous chart also creates a headless service named thanos-store-gateway. We can check the endpoints behind it simply by running a nslookup on that service.
Let’s fire an interactive shell and check it:
These IPs are for the Prometheus, Thanos store, and gateway pods.
root@my-shell-95cb5df57-4q6w8:/# nslookup thanos-store-gateway
Server:  10.52.218.10
Address: 10.52.218.10#53
Name: thanos-store-gateway.monitoring.svc.cluster.local
Address: 10.52.25.12
Name: thanos-store-gateway.monitoring.svc.cluster.local
Address: 10.52.25.41
Name: thanos-store-gateway.monitoring.svc.cluster.local
Address: 10.52.30.30
Name: thanos-store-gateway.monitoring.svc.cluster.local
Address: 10.52.30.11
Name: thanos-store-gateway.monitoring.svc.cluster.local
Address: 10.52.31.9
root@my-shell-95cb5df57-4q6w8:/#
$ kubectl get pods -o wide -l thanos-store-api="true"
NAME READY STATUS RESTARTS AGE IP NODE NOMINATED NODE READINESS GATES
prometheus-0 2/2 Running 0 100m 10.52.25.12 gke-demo-1-pool-1-649cbe02-jdnv <none> <none>
prometheus-1 2/2 Running 0 14h 10.52.25.41 gke-demo-1-pool-1-7533d618-kxkd <none> <none>
prometheus-2 2/2 Running 0 31h 10.52.30.30 gke-demo-1-pool-1-4e9889dd-27gc <none> <none>
thanos-ruler-0 1/1 Running 0 100m 10.52.30.11 gke-demo-1-pool-1-7533d618-kxkd <none> <none>
thanos-store-gateway-0 1/1 Running 0 14h 10.52.21.9 gke-demo-1-pool-1-4e9889dd-27gc <none> <none>5. Access the visualization layer
As soon as the Grafana pod is up and running, you should be able to access it at grafana.yourdomain.com.
Monitoring as a Service Alternative
An elegant alternative to hosting your own Grafana instance is to rely on third-party Monitoring as a Service (MaaS) provider that natively supports PromQL and importing metrics from Prometheus. The native support for Prometheus and PromQL allows users to rely on open-source Prometheus for data collection while removing the burden of administering a growing database and visualization layer.
The benefits of this approach are:
- A variety of UI widgets to customize dashboards
- An integrated platform for visualization, alerting, and automation
- Integration support for public and private cloud technologies
- Intelligent alerting based on machine learning
- Scalable and hosted metrics database
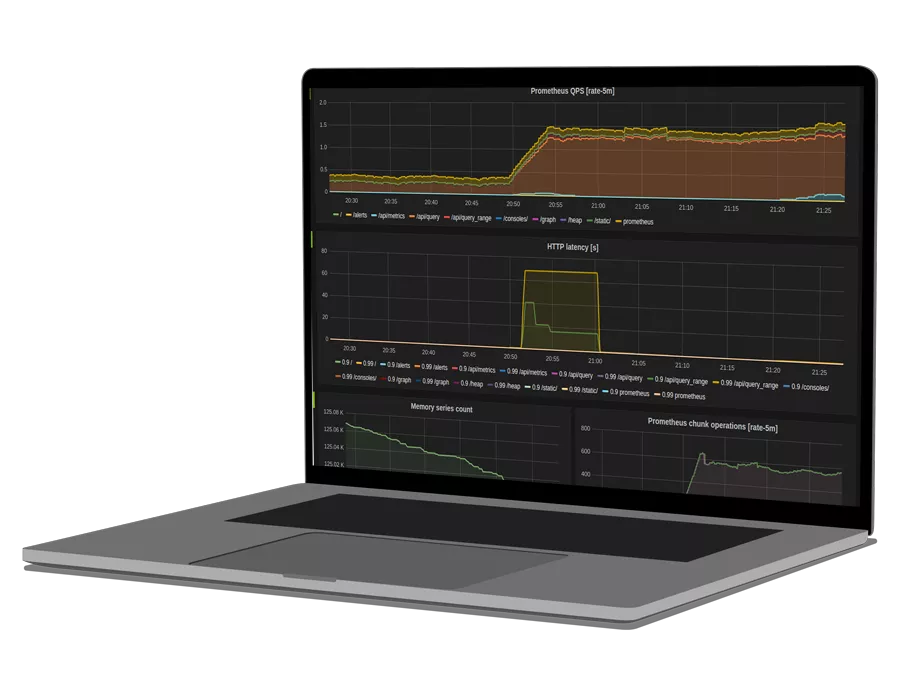
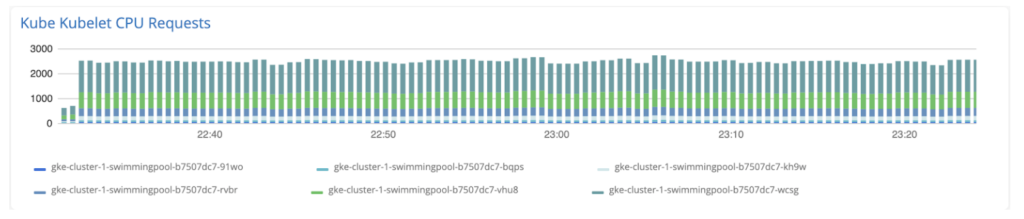
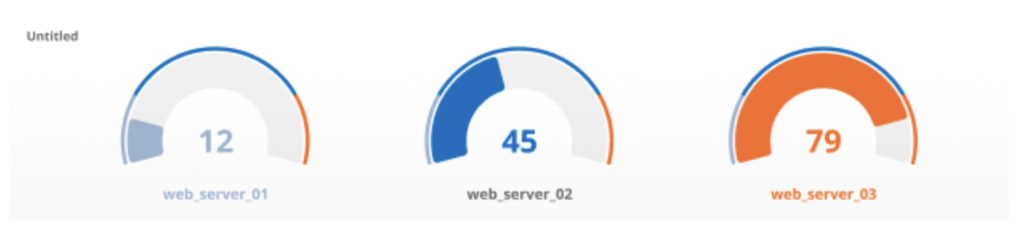
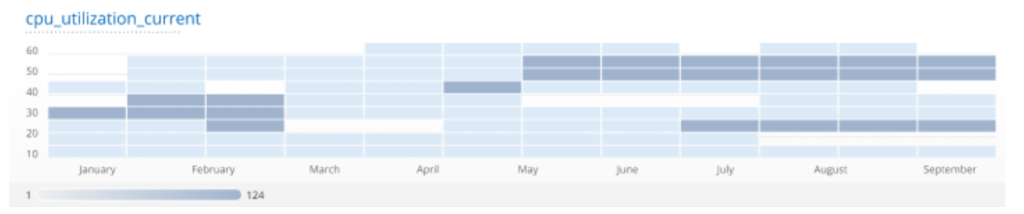
Below are a few sample widgets. You can learn more in this article about such a hosted monitoring as a service.
Things to Know About Our Sample Configuration
- Your provisioned cluster as part of our sample deployment has multiple replicas of Prometheus running, meaning that it can horizontally scale. Your monitoring system is resilient to zonal failures when your Kubernetes cluster has nodes deployed across multiple regions since you can deploy many Prometheus replicas in each region.
- Along with the Prometheus and Thanos workloads, the Helm chart also creates kube-state-metrics and node exporter workloads. While they are not a prerequisite, we highly recommend keeping them for a complete production-grade monitoring setup.
- Another critical concept is run-time metrics deduplication of HA (high availability) groups. We dedicated an earlier section of this article to explain why this functionality is required for Thanos to provide high availability.
Thanos Best Practices
- To comply with the high availability architecture introduced earlier in this article, we recommend that you run at least one extra replica of your Prometheus pod per region, preferably deployed in a different hosting region.
- Make sure you apply lifecycle and data retention policies to the cloud storage bucket for cost optimization purposes. The policies allow you to automatically control your spending on hosted AWS S3 or Google GCS services over time.
- Thanos Sidecar container uploads data in two-hour batches; therefore, if you want to bring down a Prometheus replica, make sure the maintenance window for each one of them is at least two hours apart.
- For proper security management, always expose services such as visualization dashboards, Thanos Query UI, and Alertmanager UI using an Nginx ingress controller.
- Prometheus exporters (integrations to collect metrics from third-party technologies) and pushgateway (an intermediary service to push metrics from jobs that can’t be scraped) are abstracted from other Thanos components. Once your Thanos environment is fully configured, it would be convenient to consolidate monitoring views across your technology stack by enabling additional exporters.
Thanos Constraint
While Thanos is arguably the best Prometheus clustering tool currently available, it’s not without limitations. A key restriction relates to security configuration. Thanos offers mTLS support that must be enabled for all data stores. While this level of security is critical while querying Thanos sidecars across Kubernetes clusters, it is overkill for communicating across components within the same Kubernetes cluster since processing mTLS both network and CPU intensive. A work-around exists to avoid this processing overhead that we intend to cover in a separate article, so stay tuned to our blog space for our latest articles.
See how OpsRamp enhances Prometheus in minutes with Prometheus Cortex
Conclusion
Thanos is a must-have in successfully utilizing Prometheus at scale in a production environment due to its ability to provide high availability without duplicating data and centralizing a view across all clusters. In conjunction with Thanos, we recommend using a hosted monitoring service that supports Prometheus-native queries to offload your administrative burden and enrich your monitoring solution.
You like our article?
Follow our monthly hybrid cloud digest on LinkedIn to receive more free educational content like this.
Powered By Prometheus Cortex
Learn MoreNative support for PromQL across dozens of integrations
Automated event correlation powered by machine learning
Visual workflow builder for automated problem resolution