Prometheus, Grafana, and Node Exporters are commonly used together in Kubernetes to monitor system-level application insights. These tools specifically provide node and container statistics, which allow developers to analyse real-time metrics of containers and nodes. Prometheus Node Exporter can more specifically be used to get node metrics and system-level insights.
In this article, we’ll get familiar with Node Exporter, its prerequisites needed for installation, and how to configure it for Kubernetes.
What is Prometheus Node Exporter?
A Prometheus Exporter can fetch statistics from an application in the format used by that system (i.e. XML), convert those statistics into metrics that Prometheus can utilize, and then expose them on a Prometheus-friendly URL. There is a vast library of applications that can export metrics from third parties and transform them into Prometheus metrics; that list can be found here.
Most Kubernetes clusters expose cluster-level server metrics and container-level metrics. However, node-level metrics are not provided.
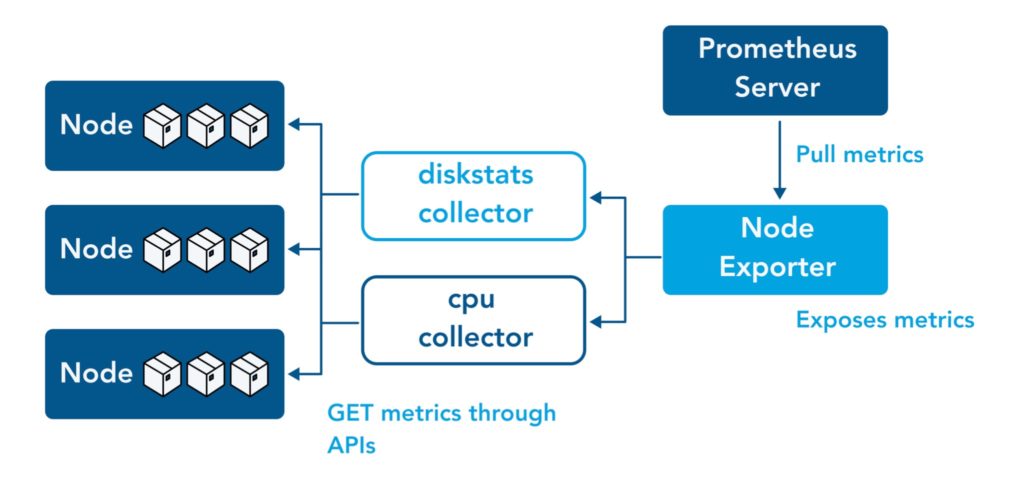
Prometheus Node Exporter provides hardware and OS-level system metrics exposed by *NIX kernels through metric collectors. Node Exporter measures multiples metrics such as:
| Memory | RAM total, RAM Used, RAM Cache, RAM Free |
| Disk | Disk Space, IOPS, Mounts |
| CPU | CPU Load, CPU Memory Disk |
| Network | Network traffic, TCP flow, Connections |
All of this information is exceedingly useful for monitoring node (or server) performance. A Node Exporter is needed on all servers or virtual machines to collect data on all nodes; Node Exporter exposes metrics on ‘/metrics’ sub-path on port 9100.
Default & Optional Collectors
A collector is a part of an exporter. It is essentially the code written to collect data of a metric, an example of a metric is “CPU core usage”, or a set of metrics. Hence, collectors also represent a metric or a set of metrics. The following diagram shows its relation to nodes, Prometheus Node Exporter and Prometheus:
You can review a list of all existing collectors for the Prometheus Node Exporter (both those enabled by default and not) here.
How to Enable Collectors
Additional collectors can be enabled by adding a ‘–collector.<name>’ flag in the ‘args’ section of a DaemonSet deployment. Collectors enabled by default can be disabled through the ‘–no-collector.<name>’ flag. We recommend thoroughly testing any newly enabled collectors before releasing them to production.
One thing you can do is monitor both the scrape_duration_seconds metric and the scrape_samples_post_metric_relabling metric to ensure that metric collection is successful and to check any changes in cardinality.
How to Disable Collectors
To disable all default collectors, use the ‘–collector.disable-defaults’ flag in conjunction with flags for all the collectors that a user seeks to use.
TextFile Collector
The TextFile collector collects metrics from text files and stores them into Prometheus. It is designed for batch jobs or short-lived jobs that do not expose metrics continuously.
To use the TextFile collector, add the ‘–collector.textfile.directory’ flag and the collector will parse all files with the glob *.prom in that directory using text format.
See how OpsRamp enhances Prometheus in minutes with Prometheus Cortex
How to Install Prometheus Node Exporter
Prerequisites
All of the following is required to deploy the Node Exporter on Kubernetes:
- A working Kubernetes cluster.
- A working Prometheus deployment within the same namespace.
- A working Grafana deployment within the same namespace.
- The Prometheus data source must also be in Grafana to allow collected metrics to be visualised.
The Kubernetes Manifests used in this guide can be cloned by running the following command:
git clone https://github.com/Shaybs/Node-exporter.git1. Creating the Node Exporter
To collect data from all the nodes within the Kubernetes cluster, you can deploy a DaemonSet. A DaemonSet allows for some (or all) pods to be scheduled and run on all nodes. The DaemonSet Controller adds a new pod to every new node that is added to the Kubernetes cluster. When a node is removed, the DaemonSet pod is garbage collected.
This is why the Node Exporter should be deployed as a DaemonSet in Kubernetes.
- Create a file named Kustomization.yml.
resources:
- node-exporter-daemonset.yml- Create a file named node-exporter-daemonset.yml and insert the following content into the file:
apiVersion: v1
kind: Namespace
metadata:
   name: monitoring
---
apiVersion: apps/v1
kind: DaemonSet
metadata:
  labels:
    app.kubernetes.io/component: exporter
    app.kubernetes.io/name: node-exporter
  name: node-exporter
  namespace: monitoring
spec:
  selector:
    matchLabels:
      app.kubernetes.io/component: exporter
      app.kubernetes.io/name: node-exporter
  updateStrategy:
    type: RollingUpdate
    rollingUpdate:
      maxUnavailable: 2
  template:
    metadata:
      labels:
        app.kubernetes.io/component: exporter
        app.kubernetes.io/name: node-exporter
      annotations:
        prometheus.io/scrape: "true"
        prometheus.io/path: '/metrics'
        prometheus.io/port: "9100"
    spec:
      hostPID: true
      hostIPC: true
      hostNetwork: true
      enableServiceLinks: false
      containers:
        - name: node-exporter
          image: prom/node-exporter
          imagePullPolicy: IfNotPresent
          securityContext:
            privileged: true
          args:
            - '--path.sysfs=/host/sys'
            - '--path.rootfs=/root'
            - --collector.filesystem.ignored-mount-points=^/(dev|proc|sys|var/lib/docker/.+|var/lib/kubelet/pods/.+)($|/)
            - --collector.netclass.ignored-devices=^(veth.*)$
          ports:
            - containerPort: 9100
              protocol: TCP
          resources:
            limits:
              cpu: 100m
              memory: 100Mi
            requests:
              cpu: 50m
              memory: 50Mi
          volumeMounts:
            - name: sys
              mountPath: /host/sys
              mountPropagation: HostToContainer
            - name: root
              mountPath: /root
              mountPropagation: HostToContainer
      tolerations:
        - operator: Exists
          effect: NoSchedule
      volumes:
        - name: sys
          hostPath:
            path: /sys
        - name: root
          hostPath:
            path: /
- If a monitoring namespace already exists, then do not copy the following part of the above code:
apiVersion: v1
kind: Namespace
metadata:
   name: monitoring
This configuration allows Prometheus to collect from all nodes. The annotations on the spec.template.metadata.annotations instructs Prometheus to scrape metrics. The annotations are added to all pods scheduled by the DaemonSet.
- Deploy the DaemonSet, with the following command:
kubectl apply -k- Check if the pods are running with the following command:
kubectl get pods --namespace=monitoringNow we must ensure that Prometheus can scrape the metrics properly.
2. Integrate Prometheus
The Prometheus server deployed on Kubernetes scrapes pods, nodes, etc. based on the annotations on the pods and services. The Prometheus server can even be configured to collect metrics based on the container name within a pod, allowing the collection of metrics exposed by containers within a pod.
Since the pods provisioned by the DaemonSet scheduler already have annotations set in their configuration, only the Prometheus scrape configuration file has to be configured to collect data from the pods.
- Add the following content to the Prometheus configuration file:
- job_name: 'kubernetes-pods'

        kubernetes_sd_configs:
        - role: pod

        relabel_configs:
        - source_labels: [__meta_kubernetes_pod_annotation_prometheus_io_scrape]
          action: keep
          regex: true
        - source_labels: [__meta_kubernetes_pod_annotation_prometheus_io_path]
          action: replace
          target_label: __metrics_path__
          regex: (.+)
        - source_labels: [__address__, __meta_kubernetes_pod_annotation_prometheus_io_port]
          action: replace
          regex: ([^:]+)(?::\d+)?;(\d+)
          replacement: $1:$2
          target_label: __address__
        - action: labelmap
          regex: __meta_kubernetes_pod_label_(.+)
        - source_labels: [__meta_kubernetes_namespace]
          action: replace
          target_label: kubernetes_namespace
        - source_labels: [__meta_kubernetes_pod_name]
          action: replace
          target_label: kubernetes_pod_name
- Verify thatNode Exporter pods are getting scraped.
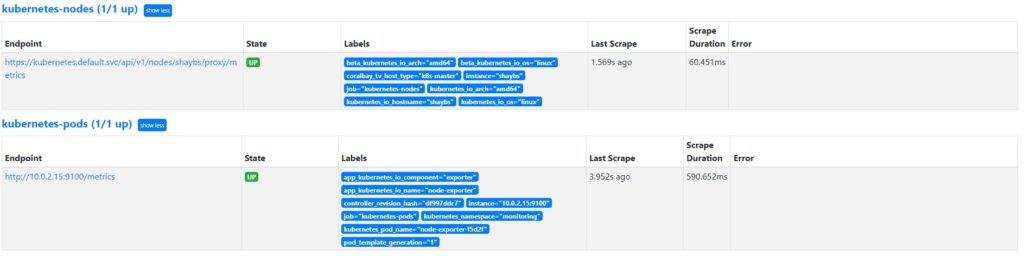
This screenshot shows that the metrics exposed by the Node Exporter pod are successfully getting scraped by Prometheus.
How to Explore Node Exporter Metrics
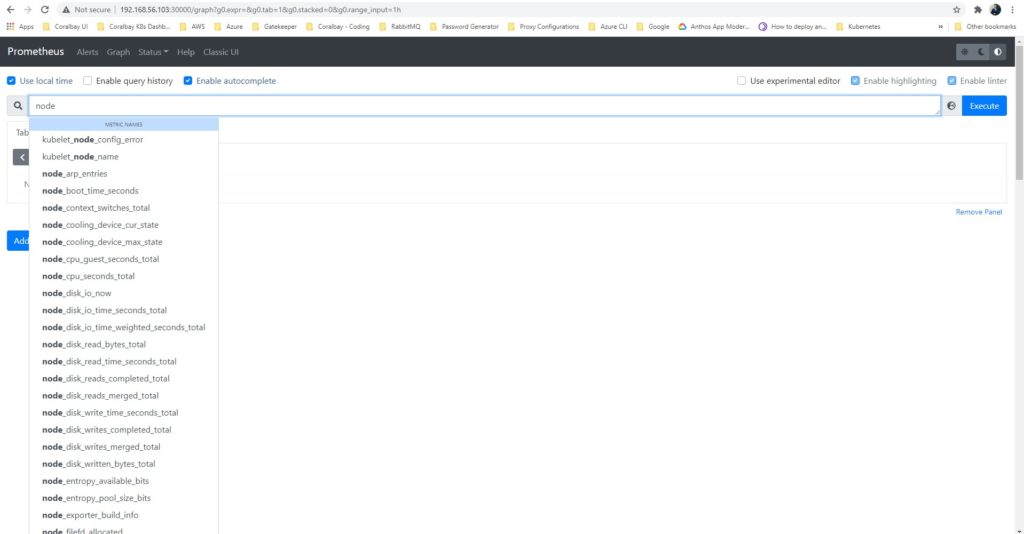
To explore Node Exporter metrics, go to the Prometheus UI and navigate to the ‘<domain-name>:9090/graph’ link in your browser. The main expression bar at the top accepts PromQL expressions.
Node Exporter metrics can be assessed by adding the ‘node_’ prefix to queries. This is because metrics exported by the Node Exporter are prefixed with ‘node_’, as demonstrated below:
Example PromQL Expressions
The following PromQL expressions are example metrics and their meanings:
| Metric | Meaning |
|---|---|
| rate(node_cpu_seconds_total{mode=”system”}[10m]) | The per-second average amount of CPU time spent in system mode, over the last 10 minutes (seconds) |
| node_filesystem_avail_bytes | Total filesystem space obtainable to users other than superuser (bytes) |
| rate(node_network_receive_bytes_total[10m]) | The per-second average network traffic received, over the last 10 minutes (in bytes) |
3. Integrate Visualization
There are different options when it comes to visualizing the metrics collected from the Prometheus Node Exporter as described below.
Expression Browser, Console Templates, and Grafana
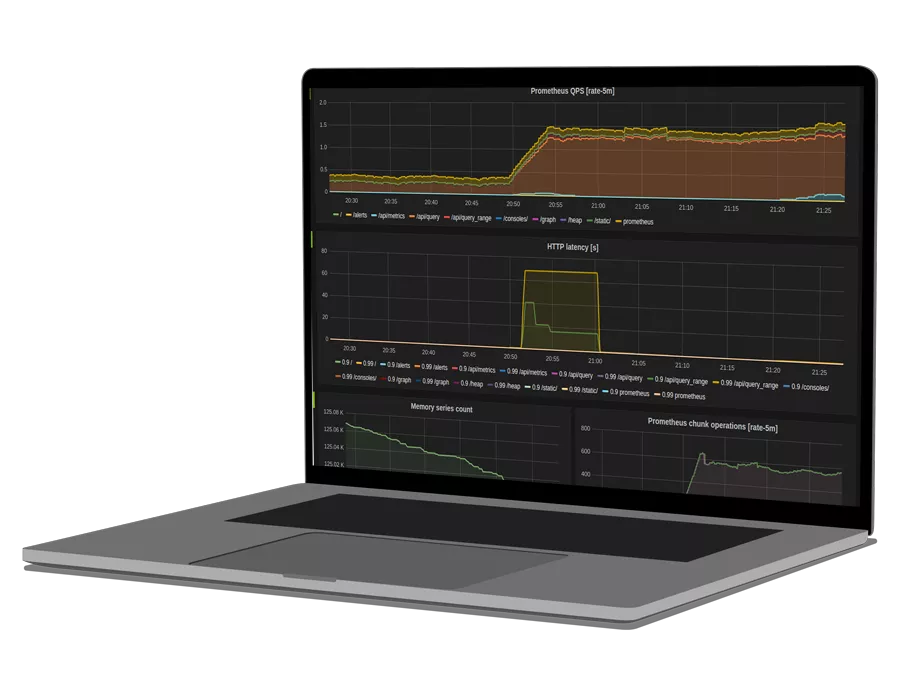
Prometheus offers a few free alternatives for visualizing time-series data in a user interface. The first is the Expression Browser designed for typing an ad-hoc query to plot a graph. The second is the use of Console Template based on the Go templating language; however, it requires an initial learning curve. And the third is Grafana that is also used with ElasticSearch and is easier to use.
Monitoring as a Service (MaaS) Based on Prometheus technology
OpsRamp is a paid monitoring-as-a-service alternative based on Prometheus Cortex. It supports the PromQL syntax and removes the burden of managing an individual time-series database for each Kubernetes cluster and instead offers a hosted database along with a centralized pane of glass across public and private clouds. It also ingests Prometheus events and correlates them using machine learning algorithms to achieve actionable alerting accuracy.
See how OpsRamp enhances Prometheus in minutes with Prometheus Cortex
Conclusion
Prometheus Node Exporter is an essential part of any Kubernetes cluster deployment. As an environment scales, accurately monitoring nodes with each cluster becomes important to avoid high CPU, memory usage, network traffic, and disk IOPS. Avoiding bottlenecks in the virtual or physical nodes helps avoid slow-down and outages that are difficult to diagnose at a pod or container level.
You like our article?
You like our article?
Follow our monthly hybrid cloud digest on LinkedIn to receive more free educational content like this.
Powered By Prometheus Cortex
Learn MoreNative support for PromQL across dozens of integrations
Automated event correlation powered by machine learning
Visual workflow builder for automated problem resolution