Prometheus is an open-source metrics storage and monitoring tool for cloud and data center management that integrates with a wide range of architecture. Many administrators rely on third-party tools to enhance the default functionality because the core Prometheus distribution does not support high availability, horizontal scaling, multi-tenancy, or long-term metric storage. In any production level system, having these additional high availability features is required to manage enterprise software at scale with custom alerts, dashboards, and analytics.
Overview
Cortex provides a highly available and extremely scalable backend to Prometheus with support for isolated metrics across the multi-tenant architecture. Cortex also provides long-term storage for customized metrics that enable historical search with charts and graphs to drive dynamic dashboard construction. This allows DevOps teams to customize their visualizations of real-time network traffic in support of cloud software applications in production or monitor other runtime events like remote processing and data mining for Machine Learning (ML).
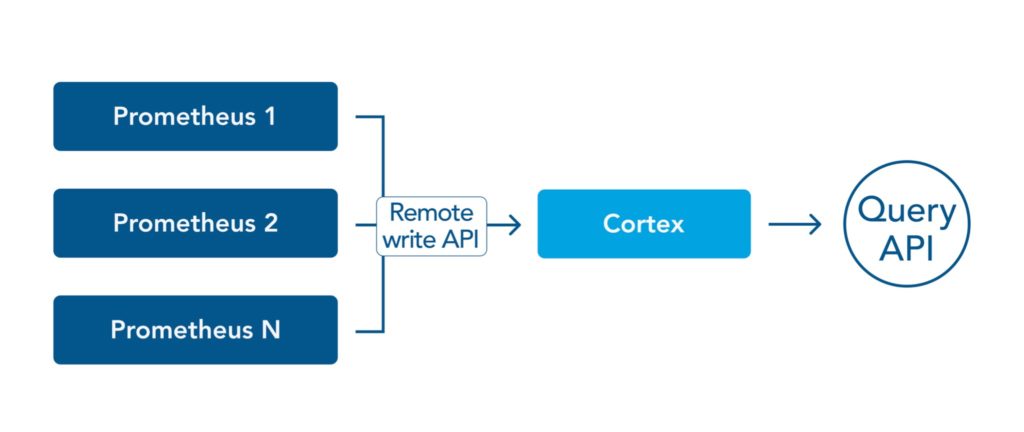
The main function of Cortex is to build upon Prometheus’s remote write API. Cortex is used as a remote write destination for one or more Prometheus instances through an exposed API query that is highly optimized compared to the default Prometheus query API. This allows Cortex to query across different Prometheus instances in support of multi-tenant architecture or multi-cloud network orchestration.
Cortex vs. Thanos
Cortex is one of several leading distributions of Prometheus that enhance the core functionality of the network monitoring capabilities. Another popular alternative is Thanos. The table below provides a comparison of the main features of both solutions:
| Feature | Cortex | Thanos |
|---|---|---|
| High Availability | Supported | Supported |
| Horizontal Scaling | Supported | Supported |
| Multi-tenancy | Supported | Supported |
| Long term metric storage | Supported | Supported |
| Metric Storage | NoSQL Stores such as AWS DynamoDB or Google Big Table | Object stores such as AWS S3 or Azure Blob Storage or Google GCS |
| Query Optimization | Support Query caching. | Limited Support for caching |
| Metrics collection system | Push based | Pull based |
| DB Format | Custom index-based time-series | Vanilla TSDB |
| Overall Architecture | Centralized approach where all metrics are available at one place | Less-centralized where data is local to each Prometheus server or cluster |
Programmers, development teams, and DevOps engineers can all benefit from the use of NoSQL database frameworks for the historical storage of time-stamped metrics data.
The next section will deep dive into Cortex’s architecture. Learn more about how it integrates Prometheus data with database or block storage frameworks for analysis.
Cortex: Deep Dive
Cortex Architecture
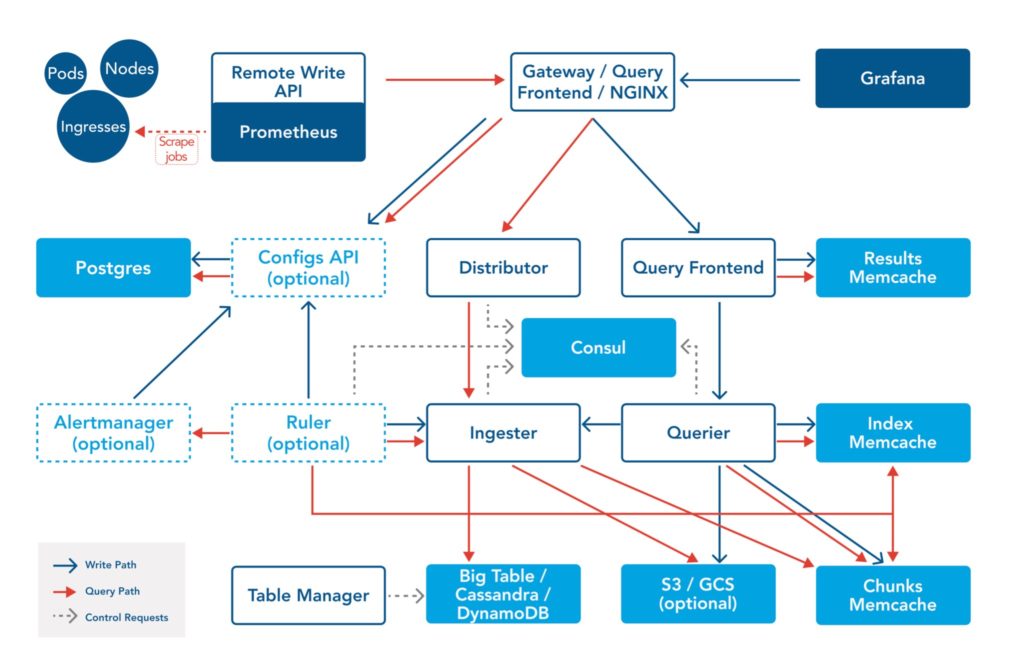
Cortex has a complex organizational structure that integrates multiple web server platforms, databases, load balancing, storage, and caching layers. The diagram below shows the operation of Cortex in a cloud data center installation using container virtualization with Kubernetes for multi-tenant software application support:
Storage
Cortex stores all incoming metrics from network activity as blocks based on the native Prometheus TSDB. Each tenant’s time series data is stored into a unique TSDB, then written out to an on-disk Block. Each block size defaults to a 2-hour time range.
Cortex implements an object storage method to support time-stamped historical data from Prometheus network metrics as block storage. At the moment the following object stores are supported by the Cortex distribution:
- Amazon S3
- Google Cloud Storage
- Microsoft Azure Storage
- Openshift Swift
Services
Cortex is a complex distributed system made up of multiple microservices, both stateless and stateful. The list below presents the main components, their role, and function:
See how OpsRamp enhances Prometheus in minutes with Prometheus Cortex
Distributor
The distributor is responsible for handling the incoming metrics from Prometheus. Upon receiving those metrics, it first performs a format validation on them. Only valid metrics are sent off to an ingestor, where they are committed to persistent storage. Distributors are inherently stateless and can be easily scaled up and down horizontally. An efficient mechanism is to scale these up when we expect a high load of incoming metrics. This service is also responsible for ensuring high availability (HA) tracking. We can have multiple Prometheus instances scraping data from the same metrics and sending them to different distributors. The distributors ensure that they are correctly de-duplicated before the metrics get persisted. To effectively perform high availability tracking, distributors need a key-value store such as ETCD or Consul to install the backend configuration.
Ingester
The ingester service is responsible for writing data to the long-term storage backend. Cortex functions as a memory-bound service since incoming data is initially stored in dynamic memory before being periodically flushed to physical storage. The flush happens every 2 hours for block storage and every 12 hours for chunks of storage.
Network administrators need to understand that if an ingester crashes before flushing data, then all in-memory data is effectively lost. However, this can be prevented using the following methodology:
- Replication: Each time series is replicated to multiple ingesters so that the system is fault-tolerant to single or “more than one” ingester failures.
- Write-Ahead Log (WAL): Write to persistent disk all incoming samples before flushing them to long-term storage. In case of failure, a recovery process replays the WAL and recovers the in-memory samples.
Querier
The Querier is responsible for handling all incoming PromQL queries. It is responsible for retrieving data from ingesters and long-term storage. This is a stateless service like the distributor and can be easily scaled up/down horizontally to accommodate incoming requests. The Querier is also responsible for deduplicating data if the response from ingester and/or long-term storage is replicated on hardware, including the ability to de-duplicate time series data.
Query Frontend
The Query Frontend is an optional service to run. Like the Querier, the Query Frontend is also stateless. We recommend running this service if you have too many clients connecting to your Cortex backend and requesting data that spans multiple days or weeks.
The Query Frontend service sits on top of the Querier. All received requests are either fulfilled from its internal cache or get added to a queue so that queries can process it. On a high level, the Query Frontend has three major functions:
- Queuing: The Query Frontend ensures that large queries do not cause OOM errors for queries. In the case of multiple queries, it distributes the load to different querier instances and finally prevents the DOS-ing of services if a single tenant requests too much data.
- Splitting: Whenever it receives a query that spans multiple days, then the Query Frontend splits those queries to different querier instances and stitches the results back as the response to the original query
- Caching: The Query Frontend can be backed by an in-memory cache or utilize an external cache such as Redis or Memcached to cache results from subqueries.
Ruler
The Ruler is another optional service to run. It is primarily used for running PromQL queries for recording rules and alerts. The Ruler requires a database to store the recording rules and alerts for each tenant. It is semi-stateful and can also be scaled up/down horizontally.
Alert Manager
The Cortex Alert Manager is an optional service responsible for accepting alert notifications from the Ruler, de-duplicating and grouping them, then routing them to the correct notification channel, such as email, PagerDuty, or OpsGenie. This module is different from the upstream Prometheus alert manager in that it supports multi-tenancy and requires a database to store per-tenant configurations. Similar to the Ruler, it is a semi-stateful service.
Configs API
The Configs API service provides a “get/set/update” API to the Ruler and Alert Manager configuration structure. The Configs API is optional to run and is stateless. The Configs API can be used in automating IaC installations or in building custom dashboard displays for network administration.
Cortex and Thanos are the two leading options to consider for cloud network administration when running a production level Prometheus-based monitoring system. Cortex is a complex system made of many modular components which require extensive configuration and administration to integrate. Thanos is comparatively simple to run.
Summary
- If your monitoring system needs to pull metrics from hundreds or thousands of servers and you have a dedicated monitoring team, then Cortex certainly fits the bill.
- Cortex will easily scale under load and provide blazingly fast query responses, but it also requires implementation and management by a dedicated DevOps team.
- For smaller monitoring needs such as those of early-stage SaaS startups, Thanos might fulfill all the requirements without the custom engineering requirements.
See how OpsRamp enhances Prometheus in minutes with Prometheus Cortex
Conclusion
If you want to run Prometheus at scale, monitor your infrastructure, and generate metrics for application workloads, then adopting Cortex is the right move. However, it takes dedication to data center engineering to run and maintain a system like Cortex. There are now much easier ways to leverage Cortex’s full potential without any extensive overhead.
Opsramp is one such solution. It is backed by Cortex and easily integrates with your existing Prometheus deployment. You can be fully up and running in less than 5 minutes. It is that easy. The entire process can be summarized as:
- Download and run Opsramp agent in your infrastructure.
- Configure your existing Prometheus instance to ship metrics to the Opsramp agent.
- Visualize the metrics on the Opsramp platform.
Opsramp allows Prometheus to easily integrate with your cloud platform environment and provide you with a single “pane of glass” view for customized metrics. You can create data visualizations from web traffic information and configure system alerts based on thresholds or machine learning.
You like our article?
You like our article?
Follow our monthly hybrid cloud digest on LinkedIn to receive more free educational content like this.
Powered By Prometheus Cortex
Learn MoreNative support for PromQL across dozens of integrations
Automated event correlation powered by machine learning
Visual workflow builder for automated problem resolution