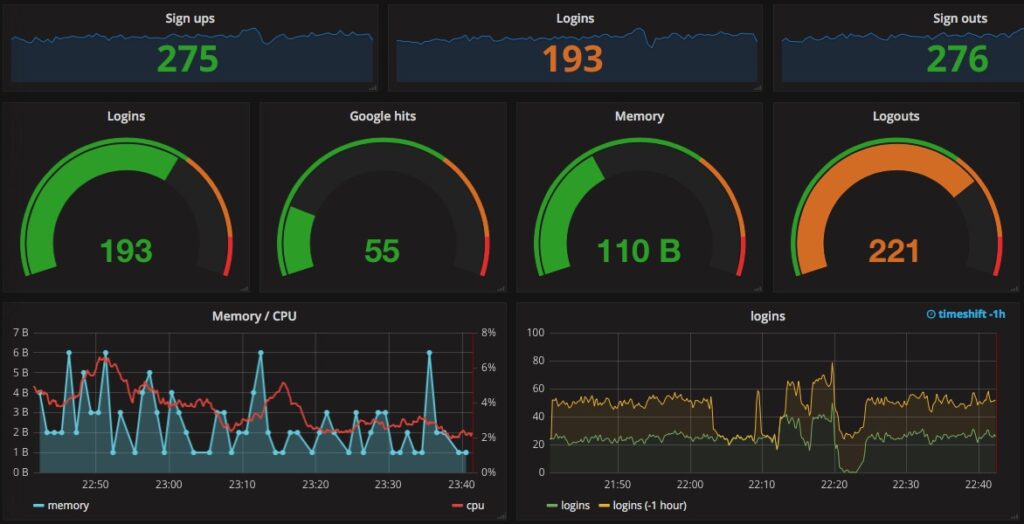
Modern applications and infrastructure components generate massive amounts of system and business metrics that operations teams need to store and visualize in near real time. While these metrics can be stored in one of many open-source time-series databases, Grafana has been the leading open-source dashboarding solution for displaying time-series data because it’s free and easy to configure.
Grafana can be self-managed where teams provision and maintain their own instances; it can also be used as a hosted cloud offering. This article compares the self-hosted approach to the hosted service offered by Amazon Web Services (AWS) and explains their respective limitations.
Bird’s Eye View
Before we deep-dive into the various features of AWS Grafana, let’s look at some advantages of a hosted Grafana offering:
- High Availability: Grafana requires high availability. In the case of a hosted offering, operations teams do not need to worry about this issue because the vendor ensures service uptime and disaster recovery in the case of failures.
- Prebuilt Dashboards: A managed offering with prebuilt dashboards makes on-ramps to Grafana very easy. This means that users need not worry about creating complex dashboards and writing Prometheus queries, since all of this is taken care of by the service provider.
- User Management: Grafana easily integrates with OAuth providers like Google and Github and offers advanced RBAC without the need for complex configurations.
- Easy Scaling: The managed Grafana service provided by AWS provisions and scales the application for your growing needs without creating any complexity for your operations teams.
The following Grafana features are common to both hosted and self-managed setups:
- Dashboard Templating: You can create reusable dashboard templates and store them in Git. These can then be consumed by your Continuous Integration / Continuous Delivery (CI/CD) pipeline to preconfigure Grafana with all the required dashboards.
- Alerting Capabilities: Grafana allows you to configure and deliver alerts based on metrics thresholds. It supports all major alert delivery options, such as PagerDuty, OpsGenie, and Slack.
- Kiosk Mode: You can have Grafana run in Kiosk mode with Playlists to see business-critical dashboards on screens throughout your office.
- Fine-Grained Access Management: Grafana offers excellent user management, where you can restrict users/teams to relevant dashboards only. You can also invite other team members easily.
- Plugin Library: Grafana has a very rich plugin library that can be used to make beautiful dashboards.
- Data Sources: Grafana can easily integrate with a large number of data sources to consume metrics.
AWS Grafana Deep Dive
A hosted Grafana offering makes the most sense given the value it generates for any organisation. Recently, Amazon Web Services (AWS) came out with its hosted Grafana offering. This eases the provisioning and maintenance of Grafana, but it also offers a few additional features.
Let’s take a look at some of the prominent features of AWS Grafana.
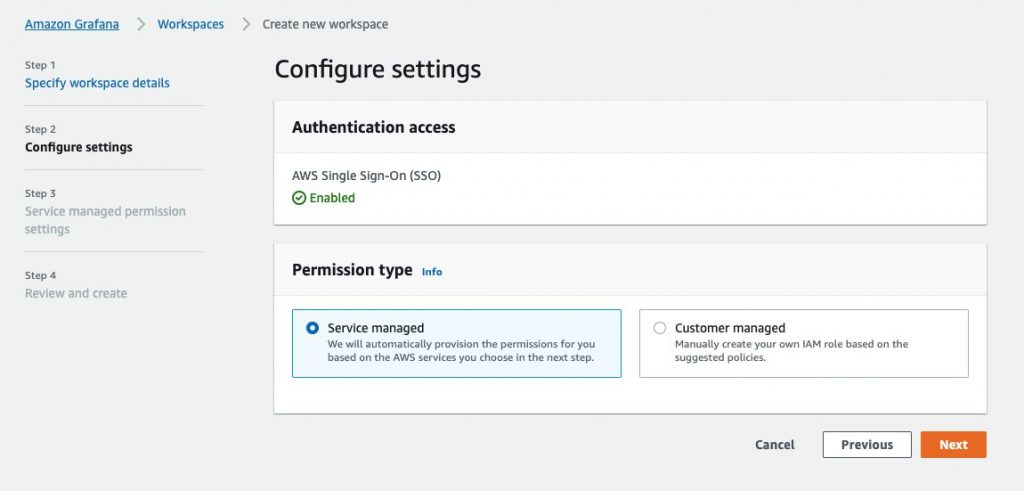
1. AWS SSO Integration
One of the major pain points of a self-managed OSS Grafana offering is user management. It does offer integration with Google, Github, etc., but it is still configuration-intensive and you would need to register the application on the authentication provider’s side as well.
AWS Grafana seamlessly integrates the AWS Single Sign-On (SSO) service, so you can easily invite other users in your organization and control their access. SSO also works very well with LDAP and other authentication providers, so you can import groups and roles directly from the authentication provider. This also allows you to enforce existing login security requirements for your company, such as two-factor authentication and password complexity.
2. Data Source Integration (Auto-Discovery)
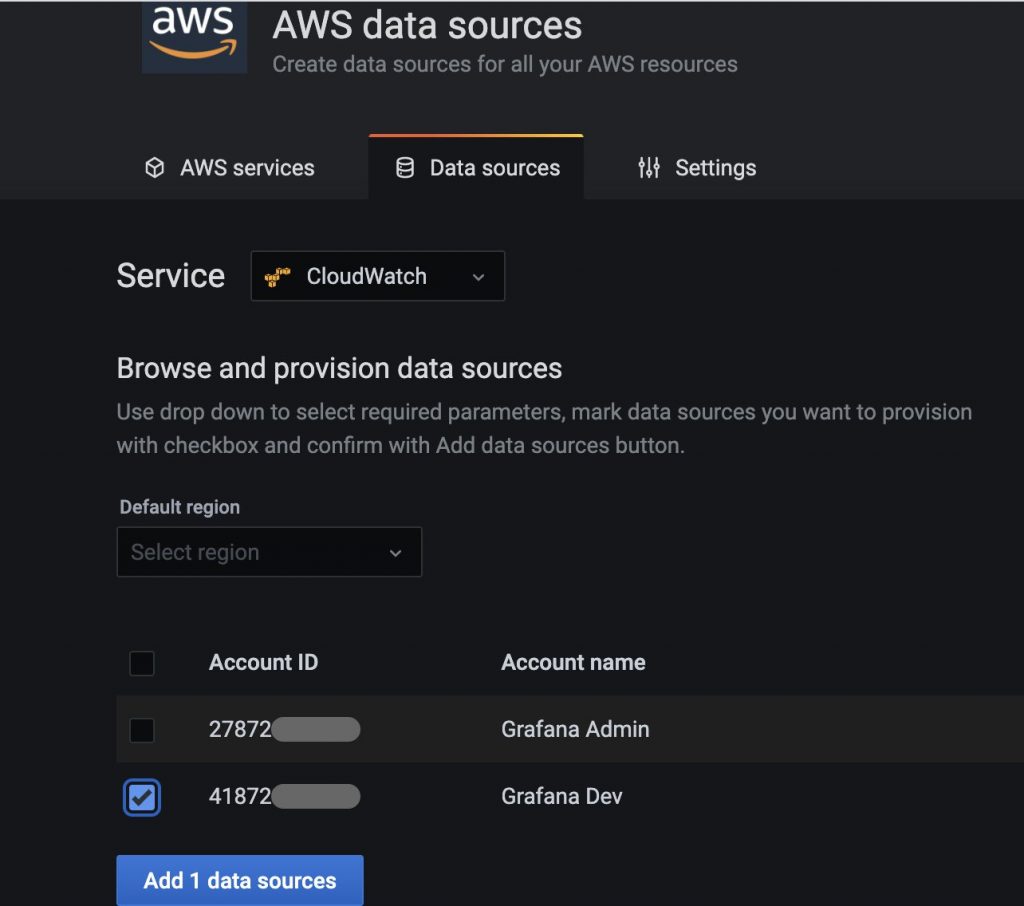
Grafana has first-class support for a lot of data sources, such as Prometheus, which is great. However, with AWS Grafana, a lot of data sources are auto-discovered during provisioning. When you provision an AWS Grafana workspace, it requires a set of IAM settings to access different services in your AWS account. These services could be AWS IOT, AWS Open Search, AWS Prometheus, AWS Cloudwatch, etc.
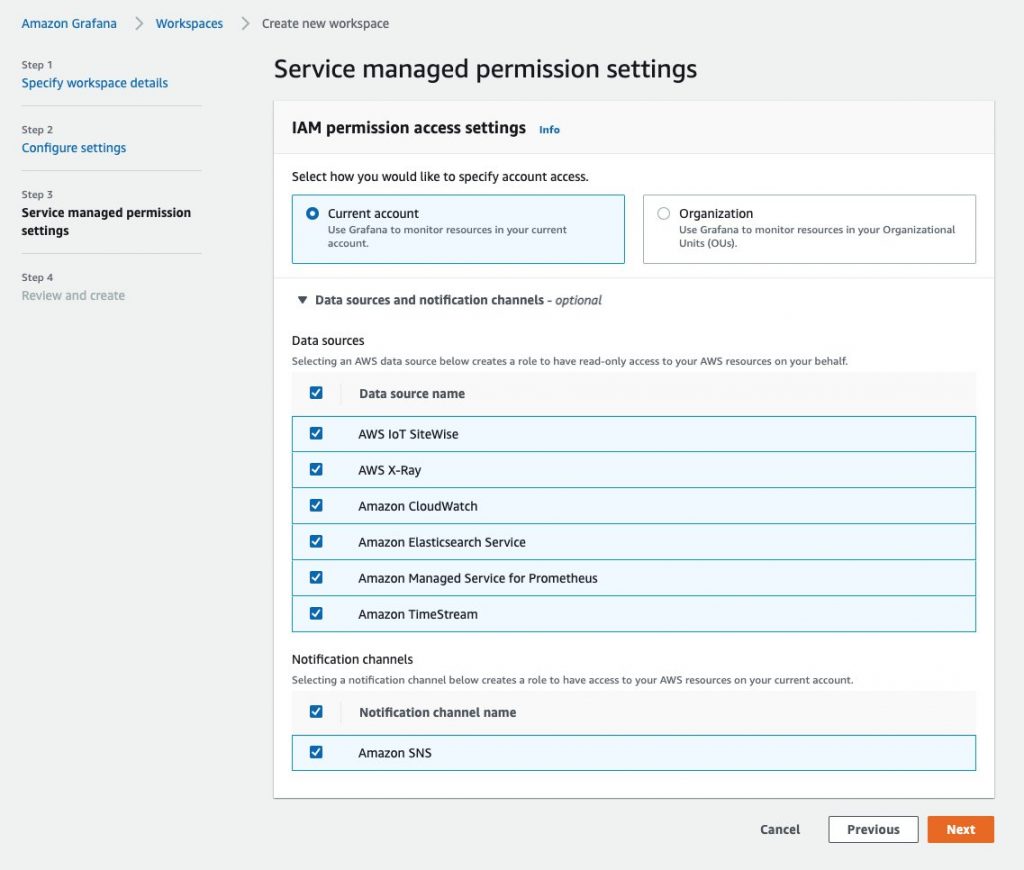
Upon provisioning, your Grafana workspace will be able to auto-discover these data sources, saving you the need for manual configuration. This is a major advantage over self-managed Grafana, since you need not worry about getting data into Grafana—AWS does all the heavy lifting for you. Of course, you can also add other types of data sources through the Grafana UI.
3. Out-of-the-Box Dashboards
Grafana dashboards are big blobs of JSON files and can be hard to manage. Creating those dashboards is also challenging since you need to take care of a lot of templating variables, functions, time range settings, etc. With AWS Grafana, you don’t need to do any of that. AWS Grafana comes with built-in dashboards for all the major data sources, such as Prometheus, Cloudwatch, etc.
4. High Scalability and Availability
AWS does a lot of heavy lifting that was traditionally done by operations teams in terms of provisioning and scaling Grafana. This allows teams to rapidly on-board users and applications.
5. Infrastructure-as-Code Integration
Managing cloud infrastructure as code is good practice. Almost all AWS services have Terraform plugins available so that changes to cloud infrastructure can be made in a controlled manner. AWS Grafana is no different. Teams can easily automate the provisioning of Grafana workspaces, adding data sources and configuring dashboards using Terraform. Terraform can also be used to automate self-hosted setups, but those Terraform configuration files tend to be extremely complex and hard to manage. This is primarily because they would also include VM provisioning and Grafana installation; on the other hand, these steps are already taken care of by the AWS Grafana Terraform provider if you choose the hosted offering.
In summary, with just a few clicks, you have a highly available, scalable instance of Grafana with prebuilt dashboards and data sources added so that you can start monitoring your services and crunching business-critical data. All the other overhead is managed by AWS.

AWS Grafana Limitations
AWS Grafana does solve some major pain points when compared to a self-managed Grafana service, but it has some limitations as well.
- Lack of Advanced Analytics and Event Correlation
Grafana does not have any built-in ML capabilities that could help with understanding the metrics data easily. It is a great tool when it comes to creating charts, etc., but it is up to the user to make sense of that output. - Data Source Auto-Discovery Limited to AWS Services
Modern application and infrastructure teams do not bet on a single cloud provider. Teams are rapidly moving toward multi-cloud and hybrid infrastructures. Not all metrics data sources reside in AWS, so they cannot be auto-discovered by AWS Grafana. One could very well argue that non-AWS data sources can be easily added to AWS Grafana, but those can also be added to a traditional self-managed Grafana service. - Lack of Automation for Taking Action
Grafana has alerting capabilities when a certain metrics threshold is breached, but it cannot take corrective action on your behalf. While alerting is good, modern infrastructure requires efficient automated systems that can ensure that corrective workflows are triggered by the time teams are alerted and engineers are available to mitigate outages.
Going Beyond Grafana
These limitations lead us to understand that we need a bigger, overarching monitoring service that not only solves the problem of managing Grafana but provides more value on top of it. To completely monitor your application and infrastructure, you need a service that integrates with modern time-series databases, such as Prometheus, and also consumes metrics from all major cloud provider sources, such as AWS Cloudwatch and Google’s operations suite.
OpsRamp is built on top of Cortex, which is highly available, horizontally scalable, long-term storage for Prometheus. It has first-class support for different cloud-provider-specific metrics, Prometheus, and other data sources. It can easily ingest large amounts of metrics data and has advanced analytics and machine learning algorithms that help reduce the mean time to resolution (MTTR) for operations teams. OpsRamp provides a single-pane-of-glass view for your entire infrastructure and application stack. It offers many more types of charts and dashboards than Grafana. It also has excellent alerting capabilities, which can deliver alert notifications to channels of your choice. It also has SSO features and can easily integrate with your organization’s authentication provider for better user access management.
Final Words
A hosted Grafana offering takes away a lot of the heavy lifting associated with data source management and dashboard templating and lets teams focus on consuming metrics that help them make key decisions.
However, it is also important to look beyond Grafana toward a complete monitoring solution that helps accelerate your organization’s multi-cloud or hybrid cloud journey—one that is powered by highly efficient AI systems to help you consume large amounts of metric data easily.
You like our article?
Follow our monthly hybrid cloud digest on LinkedIn to receive more free educational content like this.